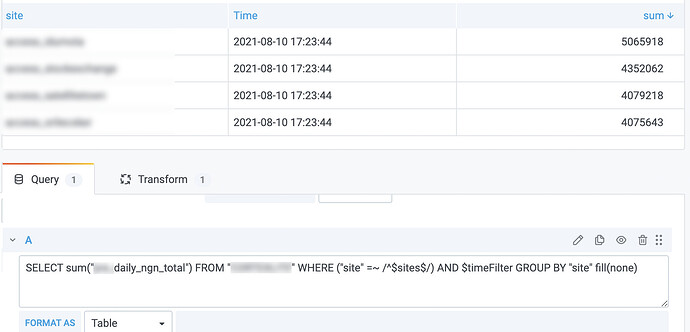
Bewildered by SUM Query Results [InfluxDB v1.8]

Hi all,

Completely flummoxed by what I had always assumed was the simplest query there is:
SELECT sum("daily_ngn_total") FROM "MEASUREMENT" WHERE ("site" =~ /^$site$/) AND $timeFilter GROUP BY "site"

The sum this gives is completely off (too high by a factor of 5), and count("daily_ngn_total") gives me 144 rather than the expected 30 over 30 days. (This metric is calculated and injected once a day, and the query is supposed to add it up over a selected time range.)

Playing with fill parameters and the min. interval and Max data points query options doesn’t help.

Tried various math with count("daily_ngn_total") and with $__interval_ms . This works for a few time ranges, but not all.

These folks seem to have had the same issue, Time(interval) grouping and data scaling - #10 by kostyantynartemov, but I doubt any of this works for varying time ranges, and I have to say I’m a bit shocked that this is actually an issue in InfluxDB.

Or am I missing anything?

Also, does anyone know if this is addressed in v2.0?

Thanks!

What does your raw data look like? (SELECT * FROM ...)

If I had to guess, it sounds like whatever process is writing that data has stored each point 5 times (each time with a slightly different set of tags).

Hi Svet,
The queried data is the result of these writes:

MEASUREMENT,ID=1EE1,site=downtown daily_ngn_total=13753,daily_kwh_total=418 1613131200000000000
MEASUREMENT,ID=1EE1,site=downtown daily_ngn_total=37556,daily_kwh_total=451 1613217600000000000
MESUREMENT,ID=1EE1,site=downtown daily_ngn_total=57353,daily_kwh_total=341 1613304000000000000

MEASUREMENT,ID=19C8,site=uptown daily_ngn_total=15433,daily_kwh_total=428 1613131200000000000
MEASUREMENT,ID=19C8,site=uptown daily_ngn_total=53556,daily_kwh_total=453 1613217600000000000
MESUREMENT,ID=19C8,site=uptown daily_ngn_total=53331,daily_kwh_total=125 1613304000000000000

There really isn’t much else to it - querying one of these sites in Chronograf directly seems to confirm that there is no redundant data:

"time","MEASUREMENT.daily_ngn_total"
"2021-08-11T12:00:00.000+02:00",
"2021-08-11T14:00:00.000+02:00","28542"
"2021-08-11T16:00:00.000+02:00",
"2021-08-11T18:00:00.000+02:00",
"2021-08-11T20:00:00.000+02:00",
"2021-08-11T22:00:00.000+02:00",
"2021-08-12T00:00:00.000+02:00",
"2021-08-12T02:00:00.000+02:00",
"2021-08-12T04:00:00.000+02:00",
"2021-08-12T06:00:00.000+02:00",
"2021-08-12T08:00:00.000+02:00",
"2021-08-12T10:00:00.000+02:00",
"2021-08-12T12:00:00.000+02:00",
"2021-08-12T14:00:00.000+02:00","21209"
"2021-08-12T16:00:00.000+02:00",
"2021-08-12T18:00:00.000+02:00",
"2021-08-12T20:00:00.000+02:00",
"2021-08-12T22:00:00.000+02:00",
"2021-08-13T00:00:00.000+02:00",
"2021-08-13T02:00:00.000+02:00",
"2021-08-13T04:00:00.000+02:00",
"2021-08-13T06:00:00.000+02:00",
"2021-08-13T08:00:00.000+02:00",
"2021-08-13T10:00:00.000+02:00",
"2021-08-13T12:00:00.000+02:00",
"2021-08-13T14:00:00.000+02:00","28501"
"2021-08-13T16:00:00.000+02:00",
"2021-08-13T18:00:00.000+02:00",

Hope this helps - I have to admit I’m a bit freaked out by this because there seems to be no rhyme or reason to it at the moment…

The numbers for daily_ngn_total in the output don’t match the numbers in your input, are you sure you’re reading and writing to the same place?

Also can you share the exact query you used to get the output?

Thanks @maxsol. Two thoughts:

  • Your line protocol writes look fine in principle. But when data is written each day, does a single point get written (for that day), or also data points written also for past days? Because one explanation of what you’re seeing is that you’re also writing historical data, but using a different ID tag (for example), which is duplicating the data.
  • Can you share your actual raw data - i.e. the result of a SELECT * type query? Which also includes all tags for each data point. It doesn’t look like what you’ve shared from Chronograf is raw data - I think it has some aggregation applied to it (and doesn’t include tags)

@mhall119 - agreed; I think what you observed probably relates to my second point

Thanks Svet, thanks Michael so far.

Can confirm that the data is absolutely clean now ​(sorry Svet, don’t know how to do SELECT * without creating a giant data dump…).
I can also confirm that by itself I do get the SUM query to work as expected, e.g. in Stat panel.
Here the plot thickens: It only does the sums correctly if I leave time($interval) in, as such:
SELECT sum("daily_ngn_total") FROM "MEASUREMENT" WHERE ("site" = 'downtown') AND $timeFilter GROUP BY time($interval), "site"
If I remove it like this,
SELECT sum("daily_ngn_total") FROM "MEASUREMENT" WHERE ("site" = 'downtown') AND $timeFilter GROUP BY "site"
it does these crazy unexplainable multiples.

Here’s the problem: Where I need this sum, namely in a table, leaving in time($interval) results in it not doing sum at all (it defaults to mean):

Changing the fill parameter doesn’t do anything, and reducing max. data points in query options to 1 gives odd, wrong results as well.

If I remove time($_interval) in the query, boom, the weird multiple again:

(The Transform you see is an Outer Join by Site, by the way.)

Does this maybe give off any leads? Thanks!

Ok, I think you need to “start from the start” and build your query up, in order to isolate the issue. There’s honestly too much going on here (too many layers of complexity) for me to keep track of, given that I don’t have direct access to your data (or knowledge of the values of variables like $site and $interval)

Firstly…

I’m not sure what the Transform is needed for, but let’s take it out of the equation for now. The Outer Join transform in particular seems prone to doing some wild things (e.g. it’s not an actual outer join - Transformations: Implement proper outer join · Issue #26316 · grafana/grafana · GitHub).

Then I’d recommend querying the database directly, using hardcoded values instead of template variables, and inspecting the raw results in a table (as you do here). You can do that in either Grafana (as you do), or Chronograf, or the Influx CLI (my go-to in cases like these).

Sorry, I didn’t quite mean that literally. Maybe something like

SELECT * FROM "MEASUREMENT" WHERE time > now() - 7d

to get a week’s worth of data. If you have a lot of sites, maybe just pull data from one site (by putting a condition in the WHERE clause. [But based on what you said I’m now more inclined to think that the issue isn’t in your data, but to do with how it’s queried or processed.]

If that looks good you can do something like

SELECT sum("daily_ngn_total") FROM "MEASUREMENT" WHERE ("site" = 'downtown') AND time > now() - 7d GROUP BY time(1d)

to make sure you get the correct sums for the last 7 days. Then when you have a table that shows the right calculation, replace (one-by-one) the hardcoded values with template variables.

Hope this helps…

Thanks for your insights Svet.

Yes, I’m pretty sure now this is more a Grafana table issue - by itself InfluxDB calculates this right.

The Outer Join I typically use to add the results of several queries into one aggregated table. However, when I apply it here it messes up the calculation, which may be in line with what you mention regarding that feature.

Without it, and with max. data points = 1 I get tantalizingly close to the right result:


It would only have to add up the two values that are in the table for a given site - like green for uptown and blue for downtown here.

Very frustrating, in any event!

Ok, that looks like good progress!

In terms of what your desired output actually is, it sounds like you just want a single value per site, right? In that case just remove the time($interval) from the GROUP BY clause altogether.

[Even if $interval is exactly as long as your $timeFilter duration, because of the way that time boundaries work in Influx, it’s unlikely that your interval would exactly overlap the query period - so the period would be split over two intervals, and you’ll get two output values.]

Does that get you where you want to be, or is it looking funky again?

That’s the thing, Svet - if I now remove the time($interval) from GROUP BY, it does reduce it to one row per site, but the value is now again completely funky.

What’s so weird is that with time($interval) grouping, we are always left with the very beginning of the $timeFilter duration and the end:

I would be willing to do all kinds of work arounds, e.g. mean("daily_ngn_total")*count("daily_ngn_total"), but without GROUP BY time($interval) count I get is completely arbitrary +/- 120…

It’s pretty hard for me to troubleshoot this from a distance, for two reasons:

  • most of the queries you’re showing in your screenshots include template variables ($timeFilter and $interval), but you don’t share the values of these. It would help if you could do that, so we can see the whole query. Maybe even use the query inspector.
  • I’m afraid to say that your approach doesn’t seem very systematic, at least based on what you’ve shared. You need to start simple, verify that the basics are working, and then build up the level of complexity until you get what you need. What you’ve shared are only the complex situations that are not working for you, but you haven’t confirmed what exactly is working. For example, previously I asked whether you get the right result if you run a simple query like SELECT sum("daily_ngn_total") FROM "MEASUREMENT" WHERE ("site" = 'downtown') AND time > now() - 7d. Can you confirm whether that works? If it does, we can take it step by step from there.

Although it might look weird, this is just the way that Influx works when you have a GROUP BY time() clause. It will use time boundaries that are aligned to Unix epoch zero, and spaced $interval time apart (I guess in this case $interval=7d?). This part of the docs specifically addresses the issue you’re seeing, and there’s also a blog post with more details about it: Time Boundary in InfluxDB Group by Time Statement · KK's Blog (fromkk). BUT let’s not get sidetracked here! It doesn’t sound like you actually need a GROUP BY time() query to do what you want, so I wouldn’t go and optimize that. Let’s just focus on getting your simple sum by site working…