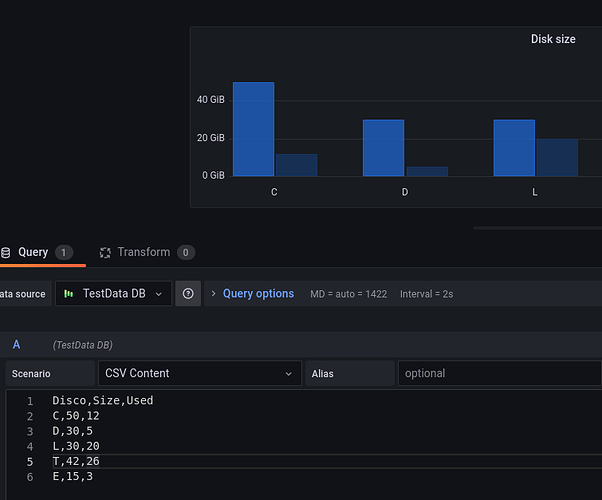
I’m trying to visualize this type of graph with data coming from prometheus. From what I understand this data source cannot show a query like the one needed for this chart.
For my example a used a fake data source with a CSV file data
Is there a way to use two queries (used and size) and merge them from the grafana interface? To get the same result? Or it is necessary that I rely on another data source, as below
THANKS, ALEN

