Hi all,
we use Prometheus (v 1.7.1) as our data source and configured a Grafana (v4.4.3) graph panel to plot the “up” state for some of our targets (value “1” meaning target is up, value “0” meaning it’s down).

We then added an alert to this graph to be triggered whenever a target became unavailable. However, sometimes Prometheus fails to gather metrics for one of the targets (possibly b/c of timeouts) and flags the up-state of that target as down (scrape interval 60 sec). We tried building an avg()-alert to only be alerted when the target goes away for more than one minute:
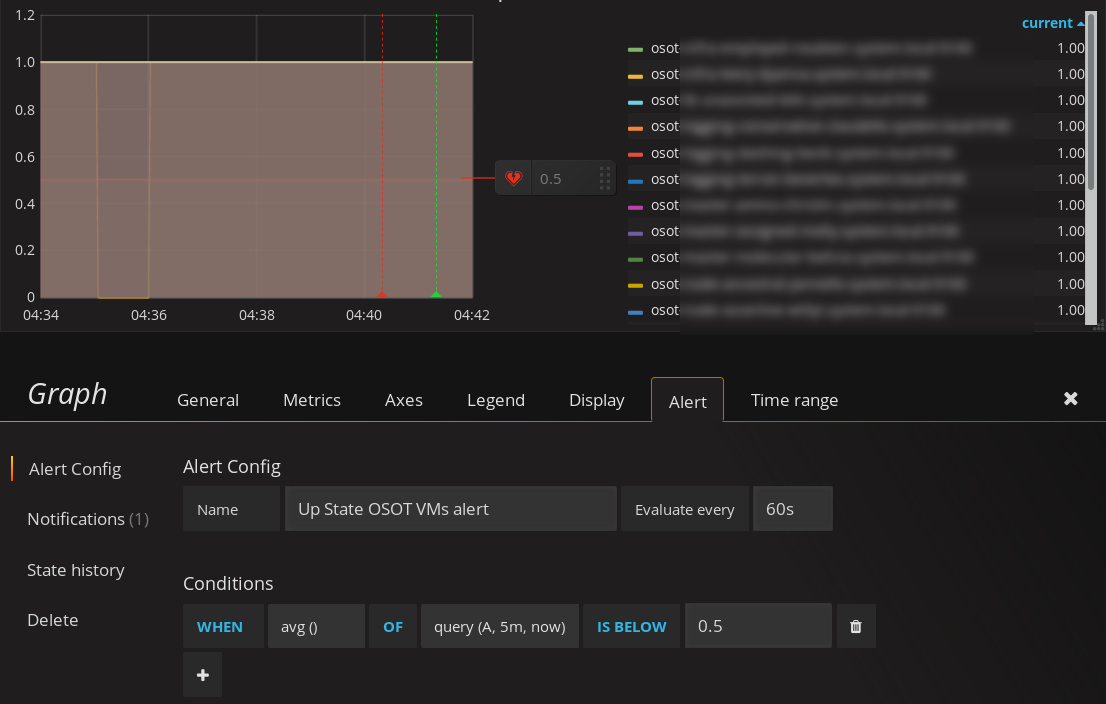
Our understanding is as follows: Alert when the average value of any target in query A from 5 minutes ago until now drops below 0.5. Given the 60 sec scrape interval in our Prometheus setup we want to be alerted when a target is unresponsive for more than 2 minutes.
As you can see one target “went down” at 04:35 and came back up at 04:36. Ideally we don’t want to be alerted. However, the above alert triggers shortly after 04:40 and goes back to OK state after 04:41. To us it seems that the average over the past five minutes (at the time of alerting) was about 0.8.
Why does the alert trigger at all and why so late? How do we fix that?
Thanks in advance,
Lorenz