Resolved: Pls check this
Devices: Centos Stream 9 + Alloy v1.9.1 + Loki v3.5.1 + Grafana v12.0.1
Installation: Non-Docker installation. (dnf install alloy/loki/grafana)
Need-1: The mikrotik router sends the BSD Syslog to Alloy, then forward to Loki, and Grafana then goes and asks Loki for the data and presents it as requested.
Need-2: Grafana can extract logs based on the time, host name, logs of the level, logs of the content of the labeling, and to display, filtering, statistics.
Problems encountered:
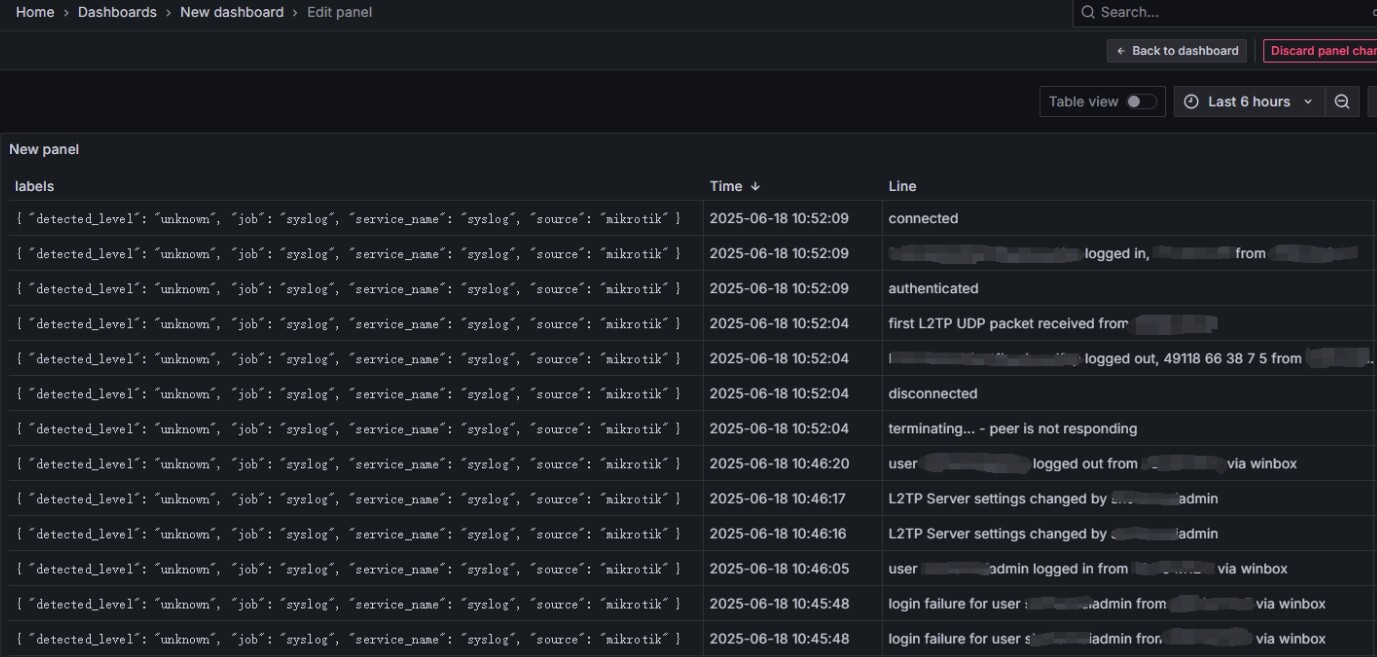
The logs collected by Grafana have no hostname and no log level, and the colon and the text before the colon are ignored in the message.
Known information:
- In the logs generated by mikrotik, the topic section contains the log level, and the message section contains an additional prefix, such as info: XXXX.
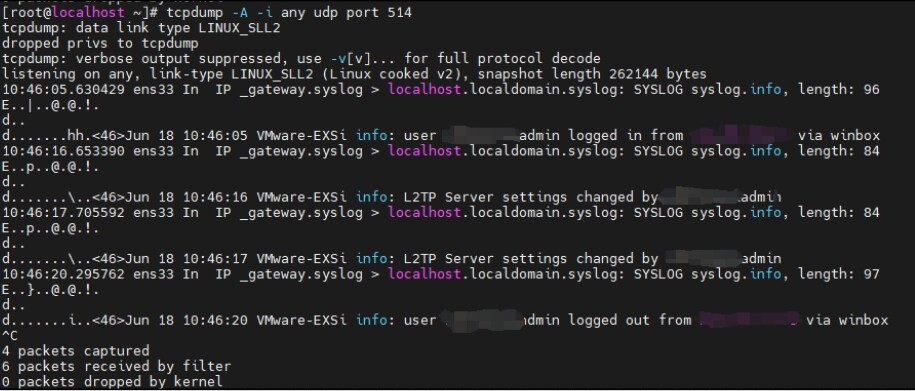
- The UDP port 514 of the Alloy can receive the complete log from mikrotik.
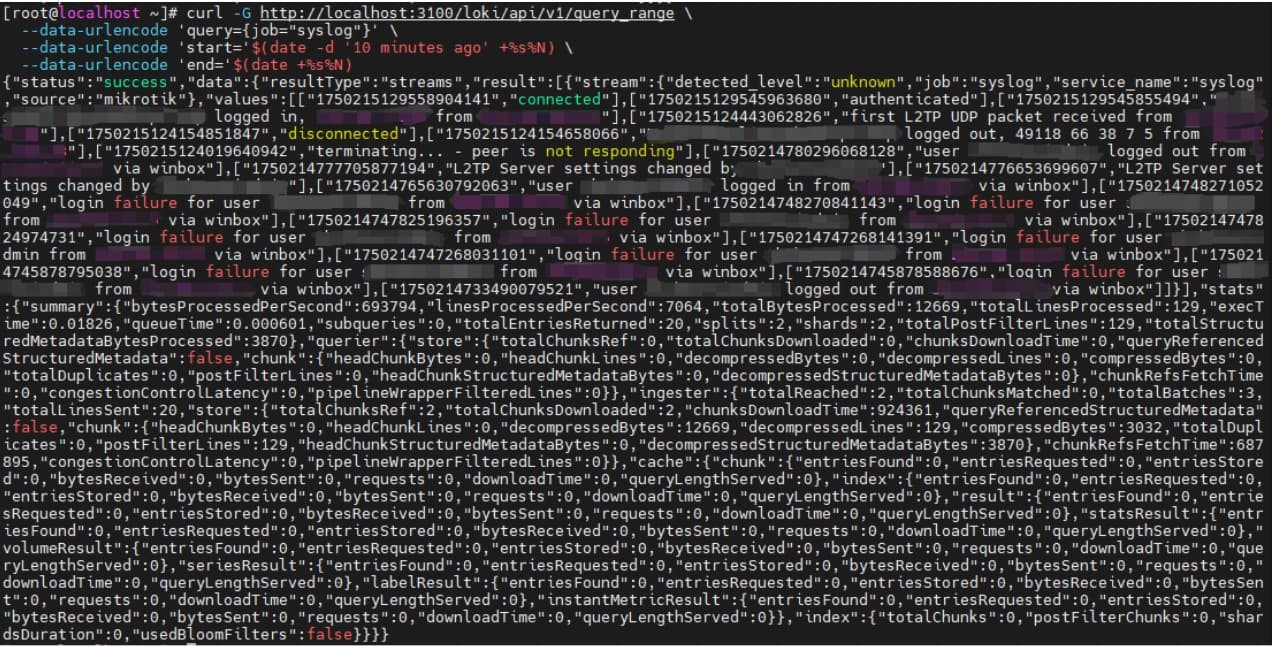
- In the logs received by Loki, it seems that the log level, colon, text before the colon, and prefix are all gone.
- Tried using Alloy’s “stage.regex” field to match the corresponding text but it didn’t seem to work.
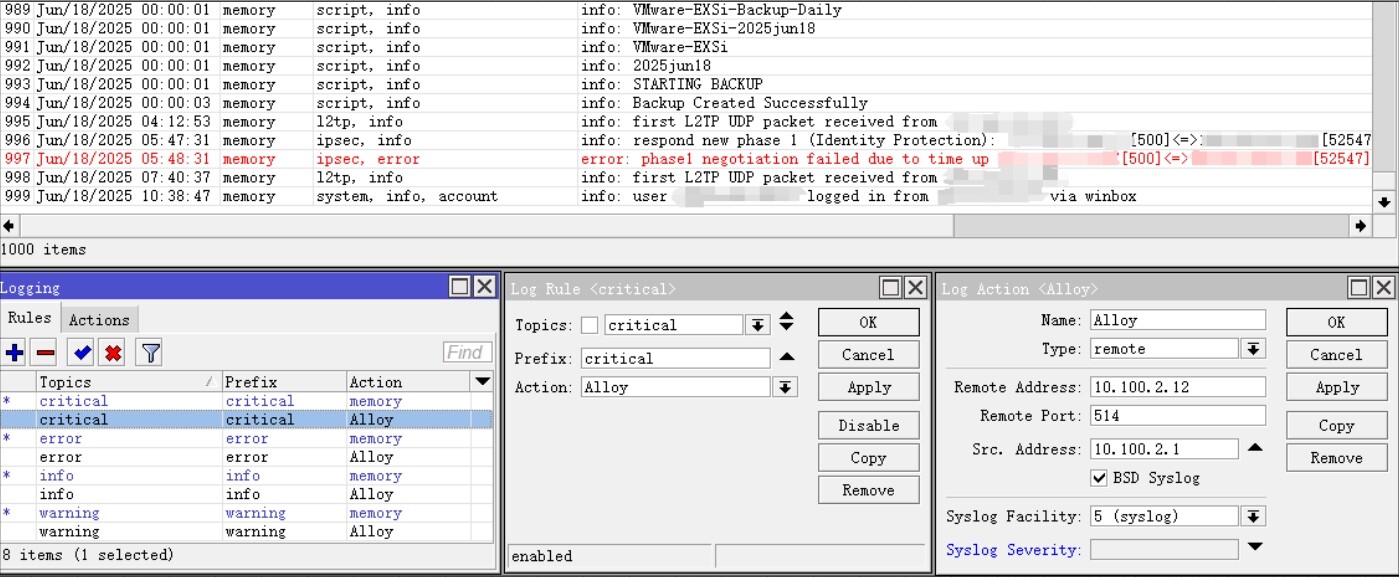
Topological map:

Alloy configuration:
loki.source.syslog “mikrotik” {
listener {
address = “0.0.0.0:514”
protocol = “udp”
syslog_format = “rfc3164”
}
forward_to = [loki.process.mikrotik_labels.receiver]
}
loki.process “mikrotik_labels” {
forward_to = [loki.write.default.receiver]
// fixed label
stage.static_labels {
values = {
job = “syslog”,
source = “mikrotik”,
}
}
// Extract levels & hostname, e.g. “info: xxx”, “error: xxx”.
stage.regex {
expression = “(?P[A-Za-z0-9-_]+) (?Pinfo|error|warning|critical)”
source = “message”
}
// Setting matches to labels
stage.labels {
values = {
detected_level = “${level}”,
hostname = “${hostname}”,
}
}
}
loki.write “default” {
endpoint {
url = “http://localhost:3100/loki/api/v1/push”
}
}
Loki configuration:
auth_enabled: false
server:
http_listen_address: 0.0.0.0
http_listen_port: 3100
grpc_listen_port: 9096
log_level: info
common:
instance_addr: 127.0.0.1
path_prefix: /var/lib/loki
storage:
filesystem:
chunks_directory: /var/lib/loki/chunks
rules_directory: /var/lib/loki/rules
replication_factor: 1
ring:
kvstore:
store: inmemory
schema_config:
configs:
- from: 2020-10-24
store: tsdb
object_store: filesystem
schema: v13
index:
prefix: index_
period: 24h
ingester:
wal:
enabled: true
dir: /var/lib/loki/wal
lifecycler:
address: 127.0.0.1
ring:
kvstore:
store: inmemory
replication_factor: 1
final_sleep: 0s
chunk_idle_period: 1h
max_chunk_age: 1h
chunk_target_size: 1048576
chunk_retain_period: 30s
storage_config:
tsdb_shipper:
active_index_directory: /var/lib/loki/tsdb-shipper-active
cache_location: /var/lib/loki/tsdb-shipper-cache
cache_ttl: 24h
filesystem:
directory: /var/lib/loki/chunks
compactor:
working_directory: /var/lib/loki
compaction_interval: 10m
limits_config:
reject_old_samples: true
reject_old_samples_max_age: 168h
ingestion_rate_mb: 4
ingestion_burst_size_mb: 6
per_stream_rate_limit: 3MB
per_stream_rate_limit_burst: 15MB
max_cache_freshness_per_query: 10m
split_queries_by_interval: 15m
volume_enabled: true
table_manager:
retention_deletes_enabled: false
retention_period: 2160h
query_scheduler:
max_outstanding_requests_per_tenant: 32768
So I came here for advice, Thanks a lot.
Best Regards
Jimmy