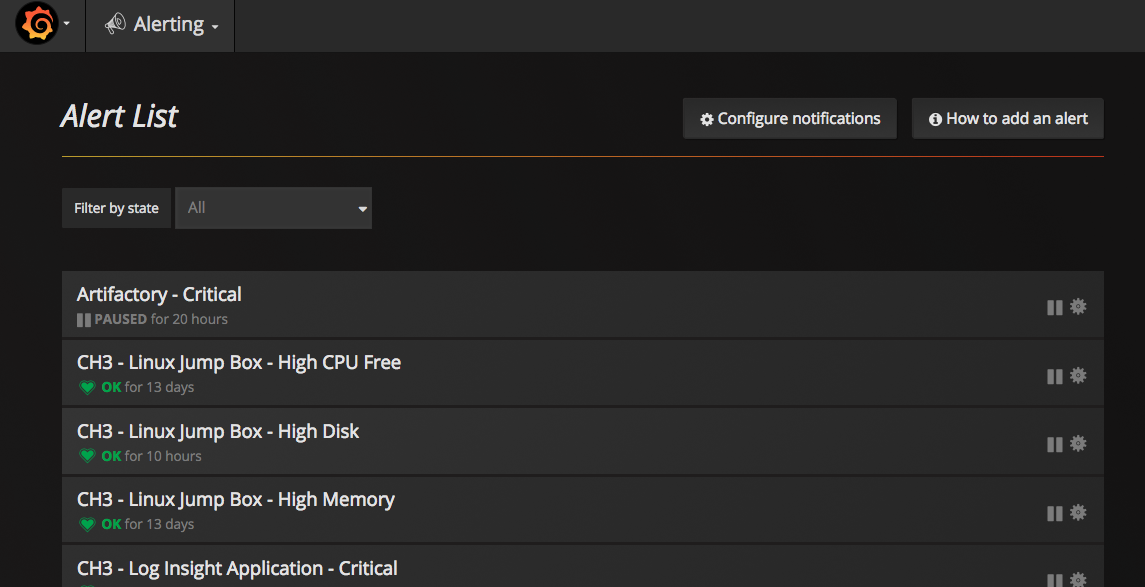
Our Grafana Alert List shows how long Alerts have been “OK”, “PAUSED”, or “ALERTING”.
However, the time shown is incorrect.
For example: I paused the Artifactory - Critical alert two seconds before this screenshot was taken, but it shows “PAUSED for 20 hours”.
I have been unable to find the same issue reported online or in the community. Looks like it may be a bug in Grafana because the settings can’t be changed. I would appreciate any insight if any one has seen this before.
Alert is set to paused: State is changed to Paused, NewStateDate is NOT updated.
Alert is set to unpause: State changes to Pending, NewStateDate is NOT updated.
Alert moves (automatically) from Pending to ok, NewStateDate IS updated.
I think because NewStateDate is not being updated when moving to Paused, the time in the UI is off.