I have a very simple influxdb table with timestamped values for power consumption. The values cumulate, for the daily chart I use this query:
SELECT difference(last("value")) FROM "infinite"."sonoff.0.DVES_4C6100.ENERGY_Total" WHERE $timeFilter GROUP BY time(1d)
Now I’d like to build another chart showing the monthly values, but all I’ve come up with is this
SELECT difference(last("value")) FROM "infinite"."sonoff.0.DVES_4C6100.ENERGY_Total" WHERE $timeFilter GROUP BY time(30d)
But that is just an aggregation of 30 days groupings relative to the current date and not the aggregation for Jan, Feb, Mar and so forth.
I could of course write a couple of lines of python code to build a kind of month table, but I wonder if there’s is an easier solution to this - given that this looks kind of like a standard pattern?
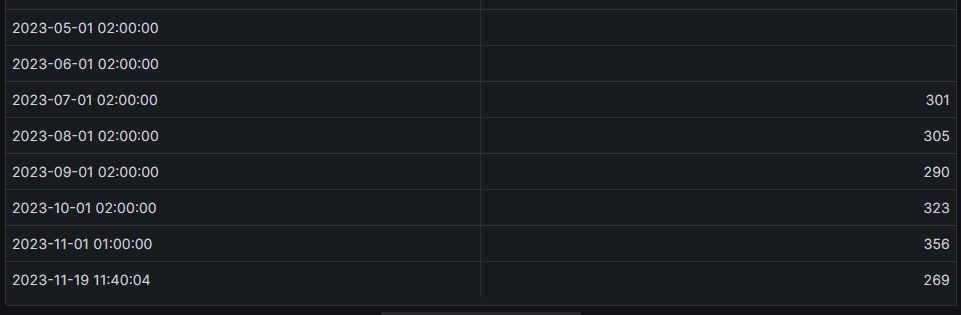
The problem here is that the timestamps are all “shifted plus one day”, i.e. if I visualize this as is in a bar chart (with x-axis time unit set to time: MM), I get the values for 06 displayed for 07 and so on, and 11 appears twice.
Or is this an issue with the UTC offsets in the timestamps - which appears on all but the last row? This is how the flux query result looks like in the influx explorer:
Well, I did what I always do in such situations: Wrote some python code to preprocess the raw data into a 2nd db which I use as input for the Grafana chart.