Aggregate _Value for each Min and Max timestamp of that value

Hello,

I’m just getting started with grafana and InfluxDB. Coming from TSQL, VBA and Lua doesn’t make it easier for me to understand the syntax of InfluxDB.

I want to get an output as list/table of the first and the last “Timestamp” to each _value which are the used external IP’s of the last 12 month. The bucket based on a list ob IPs (less than 100 different) for every login-timestamp.

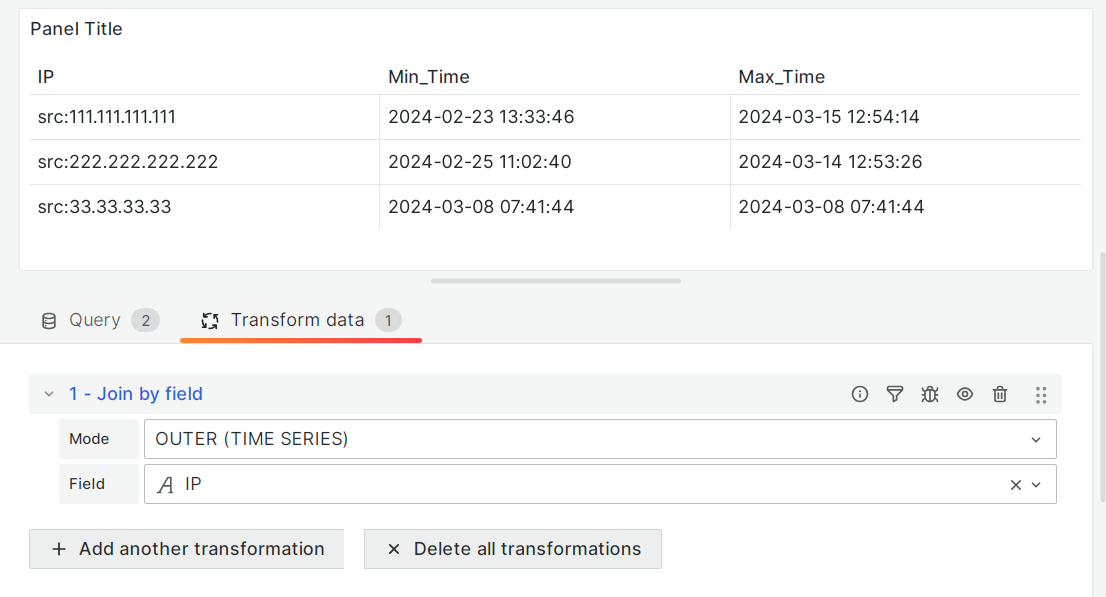
The output should look something like that:
IP | Min_Date | Max_Date
222.222.222.222 | 20240224 | 20240531

I tried this, which works with one specific IP (“222.222.222.222”) and about a Range of one month:

import "strings"
from(bucket: "TEST")
  |> range(start: -1mo, stop: v.timeRangeStop)
  |> filter(fn: (r) => r._measurement == "log"
                   and r._field       == "message"
                   and r.host         == "grafana.host.de"
                   and r._value       =~ /222.222.222.222/ )
  |> keep(columns: ["_time", "_value"])  
  |> map(fn: (r) => ({r with _time: strings.splitN(v: string(v: r._time), t: "T", i: 2)[0]}))
  |> map(fn: (r) => ({r with Min_time: strings.replace(v: r._time, t: "-", u: "", i: 2)}))
  |> map(fn: (r) => ({r with Max_time: string(v: r.Min_time)}))

But ther are 2 Errors:

  1. I get the warning: “Status: 500. Message: A query returned too many datapoints and the results have been truncated at 7961 points to prevent memory issues. At the current graph size, Grafana can only draw 796. Try using the aggregateWindow() function in your query to reduce the number of points returned.”

  2. If I change the range to “-12Mo” the warning is: “Status: 504. Message: Post “https://grafana.host.de:…”: net/http: request canceled (Client.Timeout exceeded while awaiting headers)”

I think, I have to aggregate the amount of data or have to split the query for every IP/month, but I just don’t find out how that works. I’ve tried “aggregatewindow” and “unique” but my syntax seemed to be wrong.

Perhaps someone can help me.with this.

Many thanks and best regards!

Could you post some input data and expected result for that data?

Yes gladly!
The data is alienated content, but the format is original.
Please excuse my possibly strange “Google”-English :innocent:

schematic data-format with spaces (just for better overview)

table	,_start							,_stop						,_time							,_value					,_field		,_measurement	,facility	,host			,hostname		,influxdb_tag	,severity	,source
0		,2024-01-22T15:21:17.776415506Z	,2024-05-23T09:07:32.578Z	,2024-02-23T11:33:46.252630628Z	," src=111.111.111.111"	,message	,log			,user		,grafana.host	,at-ext-vit01	,ftp			,info		,10.11.12.1
0		,2024-01-22T15:21:17.776415506Z	,2024-05-23T09:07:32.578Z	,2024-02-25T09:02:40.829679216Z	," src=222.222.222.222"	,message	,log			,user		,grafana.host	,at-ext-vit01	,ftp			,info		,10.11.12.1
1		,2024-01-22T15:21:17.776415506Z	,2024-05-23T09:07:32.578Z	,2024-03-26T11:25:26.608756586Z	," src=222.222.222.222"	,message	,log			,user		,grafana.host	,at-ext-vit02	,ftp			,info		,10.11.12.2
1		,2024-01-22T15:21:17.776415506Z	,2024-05-23T09:07:32.578Z	,2024-03-08T05:41:44.268418883Z	," src=33.33.33.33"		,message	,log			,user		,grafana.host	,at-ext-vit02	,ftp			,info		,10.11.12.2
2		,2024-01-22T15:21:17.776415506Z	,2024-05-23T09:07:32.578Z	,2024-03-14T10:53:26.456800378Z	," src=222.222.222.222"	,message	,log			,user		,grafana.host	,at-ext-vit03	,ftp			,info		,10.11.12.3
2		,2024-01-22T15:21:17.776415506Z	,2024-05-23T09:07:32.578Z	,2024-03-15T10:54:14.717935883Z	," src=111.111.111.111"	,message	,log			,user		,grafana.host	,at-ext-vit03	,ftp			,info		,10.11.12.3


real data-format
table,_start,_stop,_time,_value,_field,_measurement,facility,host,hostname,influxdb_tag,severity,source
0,2024-01-22T15:21:17.776415506Z,2024-05-23T09:07:32.578Z,2024-03-14T11:33:46.252630628Z," src=111.111.111.111",message,log,user,grafana.host,at-ext-vit01,ftp,info,10.11.12.1
0,2024-01-22T15:21:17.776415506Z,2024-05-23T09:07:32.578Z,2024-03-15T09:02:40.829679216Z," src=222.222.222.222",message,log,user,grafana.host,at-ext-vit01,ftp,info,10.11.12.1
1,2024-01-22T15:21:17.776415506Z,2024-05-23T09:07:32.578Z,2024-03-15T11:25:26.608756586Z," src=222.222.222.222",message,log,user,grafana.host,at-ext-vit02,ftp,info,10.11.12.2
1,2024-01-22T15:21:17.776415506Z,2024-05-23T09:07:32.578Z,2024-04-17T05:41:44.268418883Z," src=33.33.33.33",message,log,user,grafana.host,at-ext-vit02,ftp,info,10.11.12.2
2,2024-01-22T15:21:17.776415506Z,2024-05-23T09:07:32.578Z,2024-03-15T10:53:26.456800378Z," src=222.222.222.222",message,log,user,grafana.host,at-ext-vit03,ftp,info,10.11.12.3
2,2024-01-22T15:21:17.776415506Z,2024-05-23T09:07:32.578Z,2024-03-15T10:54:14.717935883Z," src=111.111.111.111",message,log,user,grafana.host,at-ext-vit03,ftp,info,10.11.12.3

Result I would like to have:

	IP			| Min_Time		| Max_Time
----------------|----------------|-------------
33.33.33.33		| 2024-03-08	| 2024-03-08
111.111.111.111	| 2024-02-23	| 2024-03-15
222.222.222.222	| 2024-02-25	| 2024-03-14

One of possible ways to do that is to have two queries, one to get Min_Time and another to get Max_Time for every IP.

Sample query A:

from(bucket: "TEST")
  |> range(start: -1mo, stop: v.timeRangeStop)
  |> filter(fn: (r) => r._measurement == "log"
                   and r._field       == "message"
                   and r.host         == "grafana.host.de"
|> group(columns:["_value"])
|> first()
|> group()
|> keep(columns:["_time", "_value"])
|> rename(columns: {_time : "Min_Time", _value : "IP"})

Sample query B:

from(bucket: "TEST")
  |> range(start: -1mo, stop: v.timeRangeStop)
  |> filter(fn: (r) => r._measurement == "log"
                   and r._field       == "message"
                   and r.host         == "grafana.host.de"
|> group(columns:["_value"])
|> last()
|> group()
|> keep(columns:["_time", "_value"])
|> rename(columns: {_time : "Max_Time", _value : "IP"})

To get the format you need in one table it is possible to use Join by field transformation:

To have YYYY-MM-DD format you can override unit for time columns:

2 Likes