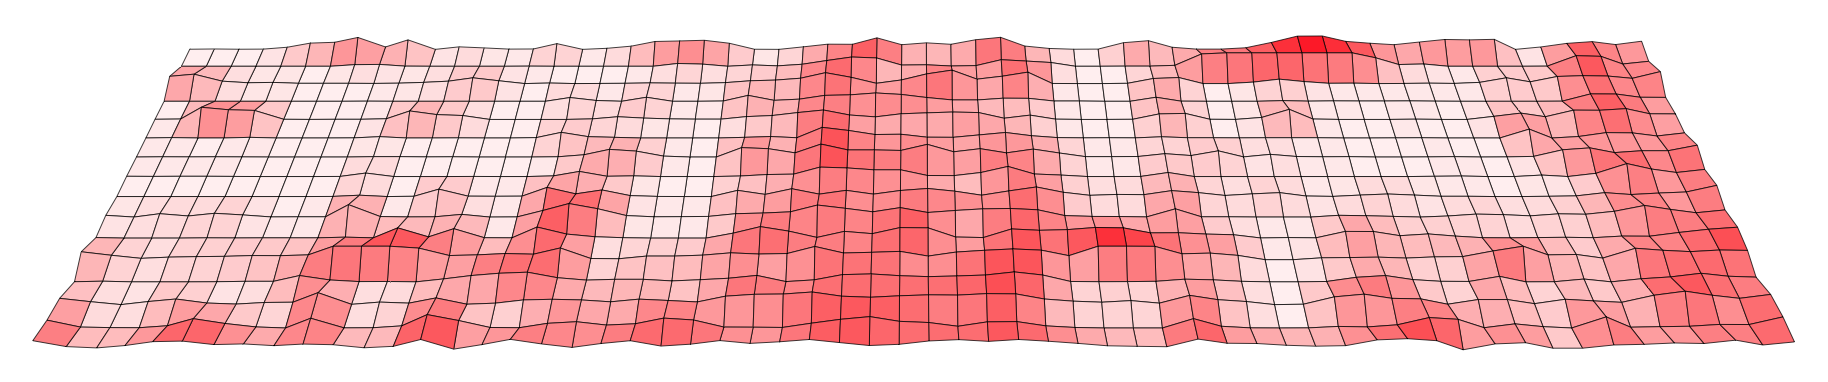
@petrslavotinek Just wondering how much work it would be to extend this to support this kind of heatmap: http://www.brendangregg.com/HeatMaps/wireframe-05-raw.png
where we can see a graph where X-axis is time, Y-axis is the CPU ID. The color depth of each tile represents the CPU ID usage.
So each Y-axes bucket/row represents a separate timeseries.
also see discussion in Multiple time-series (one per row) in heatmap