We are using the Zabbix dashboard. It works well. We have one issue though: When a Problem is reported the ‘name’ of the problem is not fully shown - example:
What we see in grafana: “\server\disk disk space is low”
What we see in Zabbix: “\server\disk disk space is low (Used > 90%)”
If I inspect the panel in Grafana the correct name is there. Is is possible to get the complete Problem name in the dashboard?
Maybe wrap the problems as a variable?
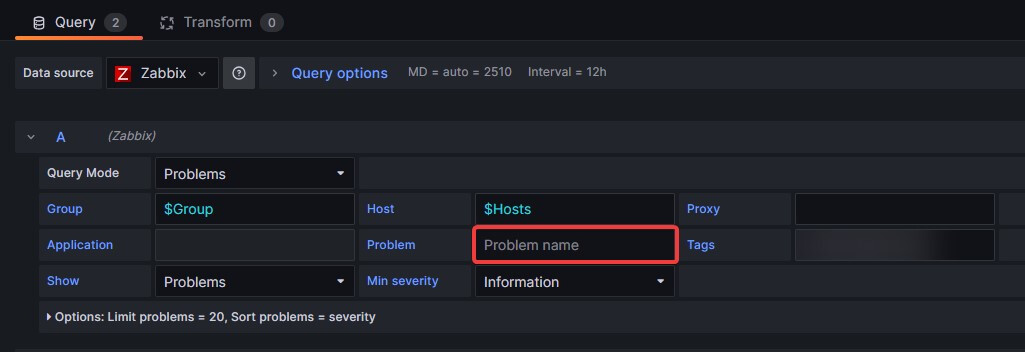
This is the current setting: