- What Grafana version and what operating system are you using?
Grafana v10.4.0, Helm chart v7.3.7, as a subchart of prometheus-community/kube-prometheus-stack-57.2.1
- What are you trying to achieve?
We are trying to visualize trace spans which overlap.
Our backend is a TCP server which connects with clients for typically 10-120 seconds. Each of these TCP connections are instrumented for tracing, and we want to visualize these traces in a timeline.
I was able to achieve this using the Gantt plugin:
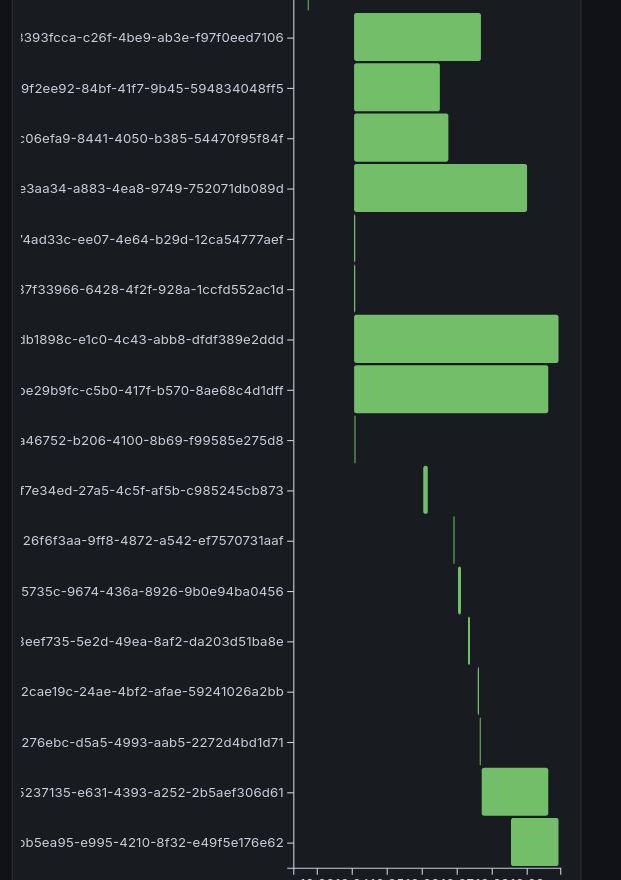
However, the Gantt plugin is unmaintained, so I want to try using the built-in “State timeline” visualization instead.
- How are you trying to achieve it?
Our tracing data comes in from the Quickwit datasource plugin, and we pass it through some data transformations to obtain this long table:
| Start Time | End Time | UUID |
|---|---|---|
| 12:03 | 12:05 | AAAA |
| 12:04 | 12:06 | BBBB |
We want to obtain a visualization which looks like this:
AAAA  [=================]
BBBB           [=================]
    12:03    12:04    12:05    12:06
The state timeline visualization only accepts wide-form data, so we would need to do a long-to-wide transformation.
It seems like either “prepare time series” or “partition by values → labels to fields” would do the trick.
- What happened?
Neither “prepare time series” or “labels to fields” are applicable to the data.
-
- “prepare time series” can transform long-to-wide, but with only one ID column with the time type (timestamp). In our case, we have two ID columns: (Start Time, End Time).
- “labels to fields” can produce wide tables, however it only works with “labels” which only exist on timeseries data coming from Prometheus.
-
What did you expect to happen?
- The “state timeline” visualization should work with long-form data.
- There should be a more flexible transformation capable of doing a long-to-wide transformation which works generically.