Use grafana to show a time series year to year comparison of temperature data

  • What Grafana version and what operating system are you using?
    Linux with Grafana 12.0.2

  • What are you trying to achieve?
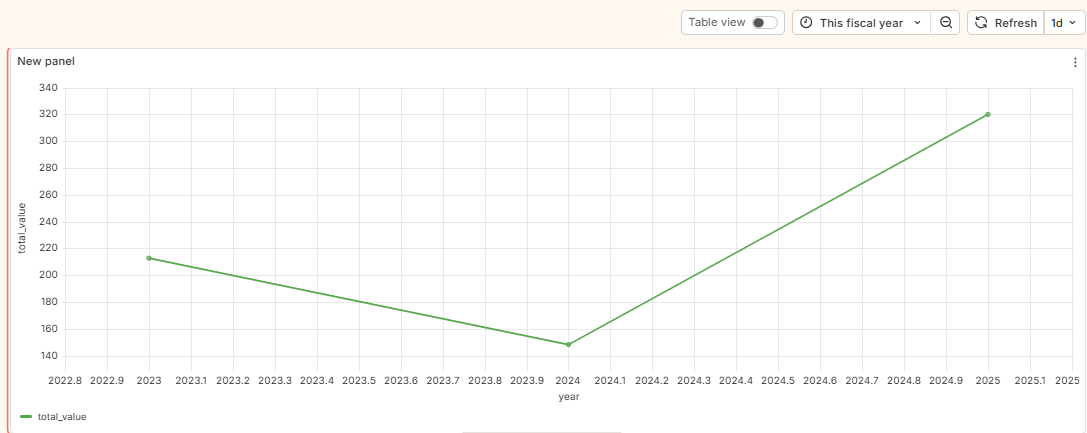
    I want a time series panel where I get to curves of my temperature data that are one year apart. At best it uses the interval that is set on top of the panel.

  • How are you trying to achieve it?
    I tried several queries I found on the internet but none of them was able to shift the second curve so that it was shown in the panel
    I tried Grot AI, but his instructions were to vague for my experience level

Since I consider my query not so extraordinary I wonder why there is no “time shift” option for curve in the time series panel. Am I missing some of the underlying concepts?

you can try this solution to resolve your Issue
Step: 1 Step up your data source and insert demo data for 2-3 year
a. Create table Like


CREATE TABLE temperature_readings (
    timestamp timestamptz NOT NULL,
    temperature numeric NOT NULL
);

b. Insert dummy data


INSERT INTO temperature_readings (timestamp, temperature)
VALUES
-- 20 data points for present year
(now() - interval '19 days', 15.2),
(now() - interval '18 days', 16.8),
(now() - interval '17 days', 14.7),
(now() - interval '16 days', 12.3),
(now() - interval '2 years' - interval '4 days', 5.6),
(now() - interval '2 years' - interval '3 days', 4.9),
(now() - interval '2 years' - interval '2 days', 4.2),
(now() - interval '2 years' - interval '1 day', 3.7),
(now() - interval '2 years', 3.1);
(now() - interval '2 years' - interval '9 days', 10.7),
(now() - interval '2 years' - interval '8 days', 9.4),
(now() - interval '2 years' - interval '7 days', 8.2),
(now() - interval '2 years' - interval '6 days', 7.9),
(now() - interval '2 years' - interval '5 days', 6.8),

Step: 2 Integrate Postgresql Data Souce in Grafana
Step : 3 execute the query for calculate the sum year wise


SELECT
EXTRACT(YEAR FROM timestamp) AS year,
SUM(temperature) AS total_value
FROM temperature_readings
GROUP BY year
ORDER BY year;

Step 4 and finaly you compare the data year Wise
Step :5 Select you visualization Like XY Chart

Final Output

Thanks for the explanation.

But I’m afraid, I can’t follow you.

I have time series data in an InfluxDB.

I want two graphs of Temperature.

One with the actual values for the interval selected in the graph
And a second with the same datasource and sensor value but time shifted 1 year back (or 2 or …)

The most easy thing to do that would be an option in the query that says time shift.

Sure it is not as easy as it sounds as you might not find data points that are exactly one year away but with a little fuzziness allowed this should be possible.

I found a time shift field in the documentation. But I don’t find it in my installation.

EDIT: never mind, I’m blind…

But: this shifts the whole panel. I would like to have an individual time shift for Query B