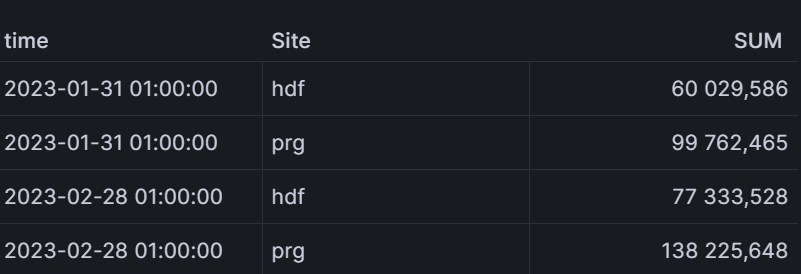
I have a mySQL query and a table dashboard like this:
with T as (
SELECT
  read_date as time,
  gasconsumption_kWh as value,
  mid(MP,5,3) as Site
FROM ems.naturalgas_consumption
Where
   MP like '%tnv%'
)
select time,Site, sum(value) as SUM from T
group by time,Site
order by time
The result:
How should I modify the query to see Site names as Column names?
