Hi guys,
Thank you for reading these questions. I am a novice when it comes to Grafana and Prometheus. Currently, I would like to deploy a dashboard to track the daily backup count of my AWS account.
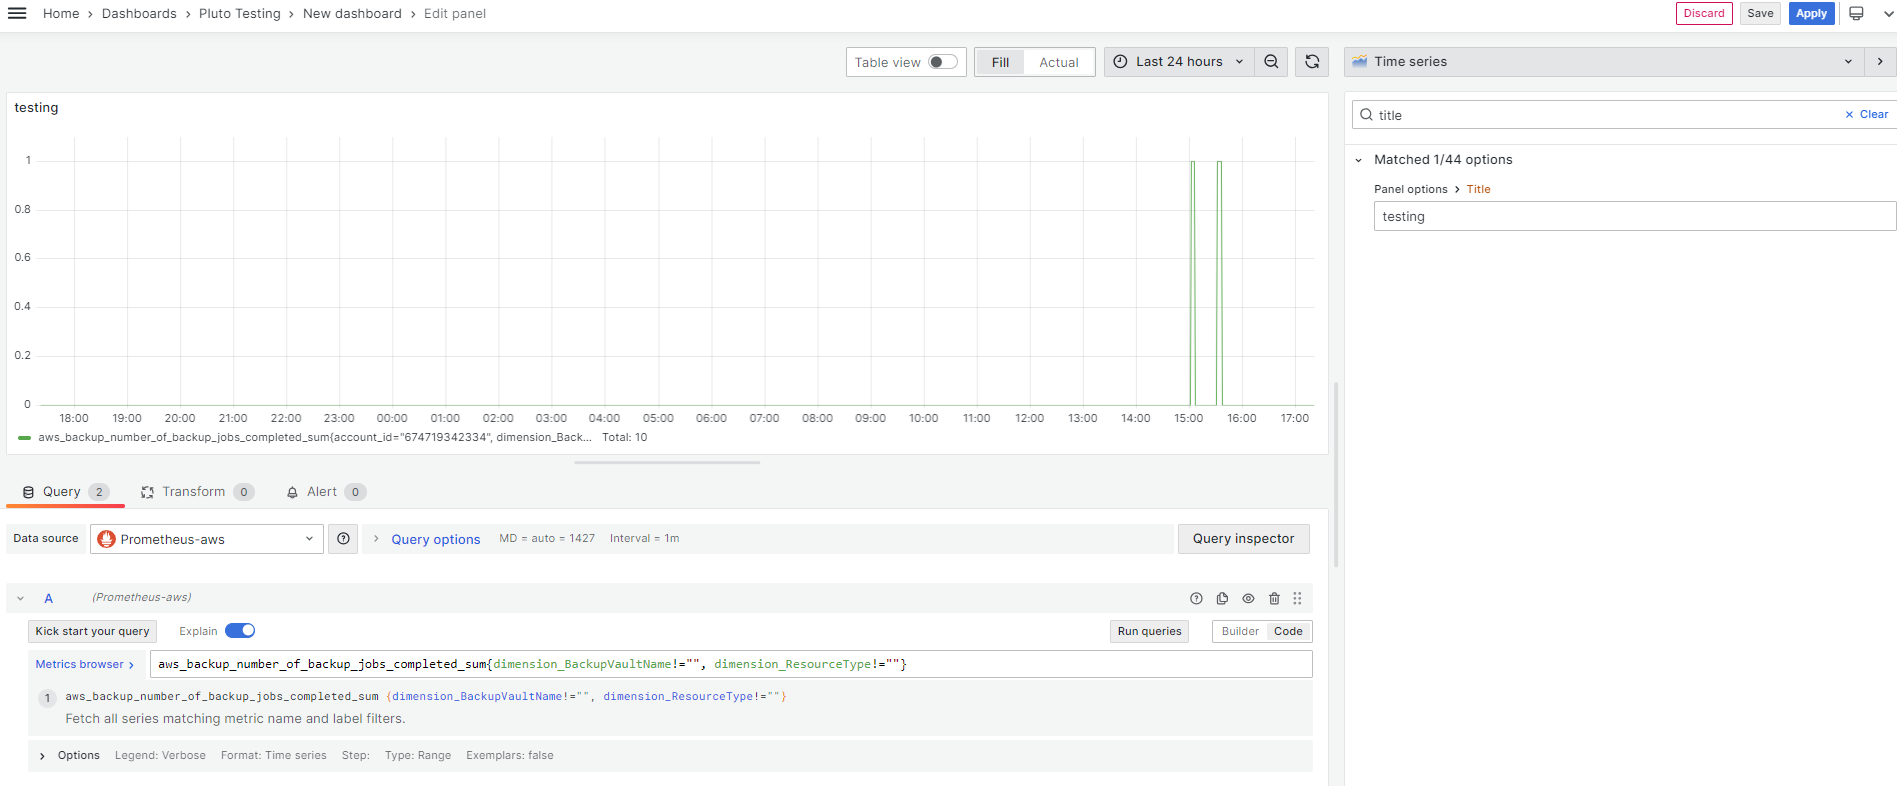
For now I can get the aws backup result form aws cloudwatch like the below photo, here we can see there are 2 backup job in this chart, but I don’t like the output as line chart, is it possible to sum this output just a number to know my daily backup number ?
I have attempted to utilize stat visualizations or the Prometheus query
count(aws_backup_number_of_backup_jobs_completed_sum{dimension_BackupVaultName!="", dimension_ResourceType!=""}) , but it has yielded incorrect results. Thank you, everyone, for your assistance.