Hi everyone,
Has anyone been able to sort the values in a bar chart eCharts dashboard?
I’m using the Infinity plugin, getting information of MITRE Tactics from an API, grouping and summarizing by tactic, and when I try to sort the values obtained using a “sort by” transformation, in a table it shows fine, but in the eCharts panel the panel is empty (without sorting I can perfectly see the values in the bar chart eChart panel, but with sorting the panel turns empty).
Table view:
Bar Chart eCharts Panel without “sort by” transformation:
Bar Chart eCharts Panel with "sort by"transformation:
I tried to use the .sort function inside eCharts Panel code, but with no luck.
Does anybody know how to do it?
Thanks in advance.
Regards,
Alejandro
@alejandroguida Take a look at the screenshot.
Some transformations are changing data frames. You can display the returned data using console.warn(data) and then check whats inside.
The values are in the values.order instead of values.buffer, which we provide in our examples.
Hi @mikhailvolkov , thanks for your explanation.
My question then is how can I sort the bars of this new returned data from max to min (I tried again on the code of the plugin with sort function, on the data series and on each axis, with no luck), and additionally and more important, how can I add/obtain again the original corresponding labels (in my case the names of MITRE Tactics on X, and the total number of them on each bar on Y) in the axes,
At the end, what I need is to get exactly the same bar chart that I obtain with the original bar chart plugin of Grafana:
Thanks in advance for your help.
Regards,
Alejandro
@alejandroguida I did not realize, that order returns the positions of the elements when elements are moved to source.buffer.
Here is an example:
- Set array with order identifiers.
- Set array with values.
- Get ordered values for each array.
Let me know if it works for you.
let names = [];
let amounts = [];
data.series.map((s) => {
  names = s.fields.find((f) => f.name === 'Name').values.source.buffer;
  namesOrder = s.fields.find((f) => f.name === 'Name').values.order;
  amounts = s.fields.find((f) => f.name === 'Amount').values.source.buffer;
  amountsOrder = s.fields.find((f) => f.name === 'Amount').values.order;
});

const namesOrdered = namesOrder.map((i) => names[i])
const amountsOrdered = amountsOrder.map((i) => amounts[i])

return {
  grid: {
    bottom: "3%",
    containLabel: true,
    left: "3%",
    right: "4%",
    top: "4%",
  },
  tooltip: {},
  legend: {
    data: [replaceVariables('$var')]
  },
  xAxis: {
    data: namesOrdered
  },
  yAxis: {},
  toolbox: { feature: { restore: {} } },
  series: [
    {
      name: replaceVariables('$var'),
      type: 'bar',
      data: amountsOrdered
    }
  ]
};
Amazing @mikhailvolkov , worked perfect:
Thanks for all your help.
Regards,
Alejandro
A tip for anybody that read this post and is using Grafana 10 now:
The values.order array is not exist anymore in Grafana 10 when you use “sort” transformation. Now Grafana return directly the values sorted, so you don´t need to create namesOrder and amountsOrder series like the example, with names and amounts series is enough to get the result sorted in the Apache Echarts graph.
Regards,
Alejandro
@alejandroguida That’s great! Thank you for sharing.
Hi everyone.
I wanted to confirm (fairly related to this post) that echarts don’t work when you apply grafana transformations.
I get black charts when I have transformations applied. Is there a workaround?
@badikipiten It works.
Grafana 10 introduced breaking changes for values.buffer and transformations.
More in the documentation and release blogs.
Can you assist. This is my json structure. I’m trying to get the hang of getting a basic chart to show and with transformations it doesn’t. We’re running grafana v10.1.5
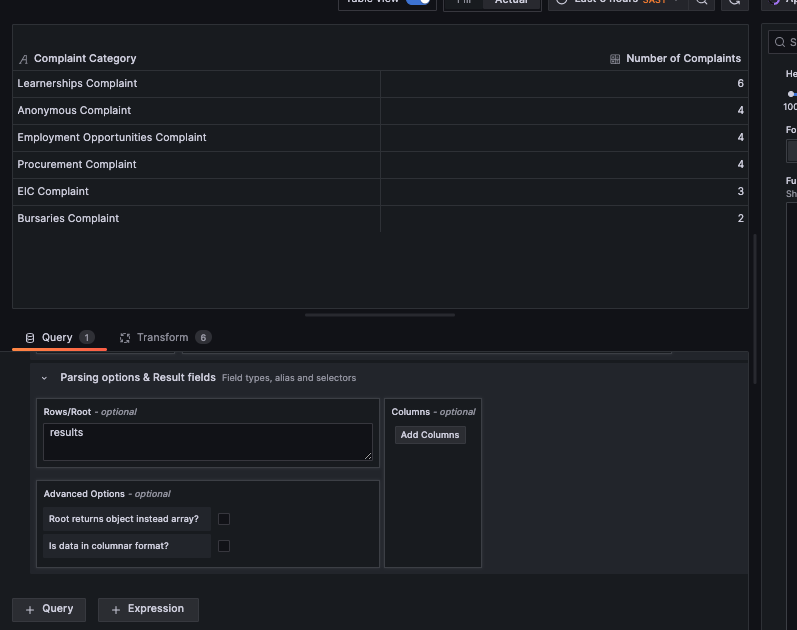
[Complaints Category>>Complaint Category]

This is what we’re trying to achieve.
@badikipiten Check the returned JSON structure and parse it accordingly:
console.error(data.series);
This is my structure:
let names = ;
let amounts = ;
data.series.map((s) => {
if (s.refId === ‘A’) {
names = s.fields.find((f) => f.name === ‘Complaints Category’).values.buffer ||
s.fields.find((f) => f.name === ‘Complaints Category’).values;
amounts = s.fields.find((f) => f.name === ‘Number of Complaints’).values.buffer ||
s.fields.find((f) => f.name === ‘Number of Complaints’).values
}
});
return {
xAxis: {
data: names
},
yAxis: {
type: ‘value’
},
series: [
{
data: amounts,
type: ‘bar’,
showBackground: true,
backgroundStyle: {
color: ‘rgba(180, 180, 90, 0.2)’
}
}
]
};
This is a data source response, which becomes something else after transformations.
You don’t need to guess how the transformed data looks. Just display it in the browser’s console using this code in the Apache ECharts function and then, depending on the output, parse it to names and values.
console.error(data.series);
Maybe I am not understanding you but I need to do transformations because I have a “Group by” transformation with a “count” calculation that I want to use to display the number of complaints. I have been playing around the transformations so when I apply the “Group by” transformation, and use the results of the transformation in echarts I get a blank chart.
The data I want to use is in a nest, under “data”

I need to get to this

and because there is no count of complaints, I have to apply “Group by” then calculate:count to get the number of complaints.
Dummy Data.
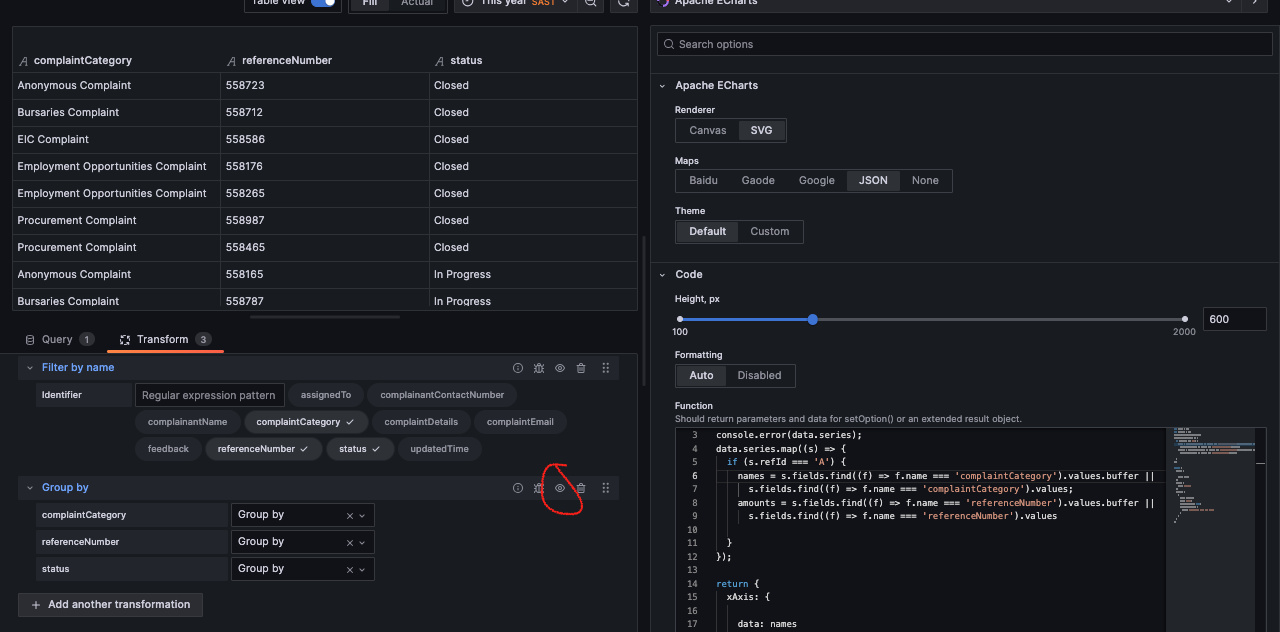
When “Group by” is disabled
When “Group by” is enabled
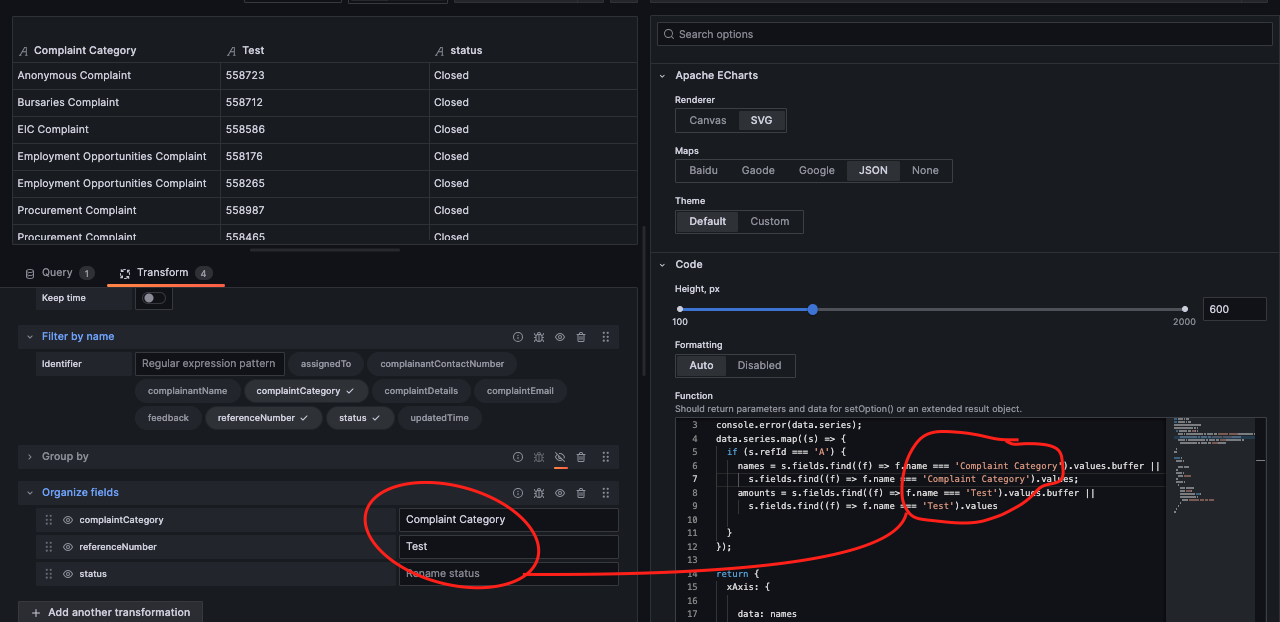
When Organise fields" is enabled
This is my actual required transformation case required.
@badikipiten I see that you added console.error(data.series) in your code. This command prints JSON inside data.series to the Browser’s console to investigate.
To see it in Chrome, right-click and select ‘Inspect’ → Console. This is how it should look like.
Looking at the JSON, you can see the field names and reference Id (refId), which will help you to parse it and use it in ECharts to display:
I would recommend checking our documentation and YouTube tutorials, which explain everything you need to work with Apache ECharts
Hi. I went through the Tutorials but none of them have the transformations.
These are the response from console.
With “Group by” and “Organise” deactivated I get the chart, but the transformations seem to duplicate for some reason.
With “Group by” and “Organise” activated, the first two transformations no longer show on the response, this could be the reason why I am not able to see the chart because the first two transformations no being there, “Group by” and “Organise” are applied to data that’s not there
The data from the two fields that I want to have on the chart is there on the both occassion.