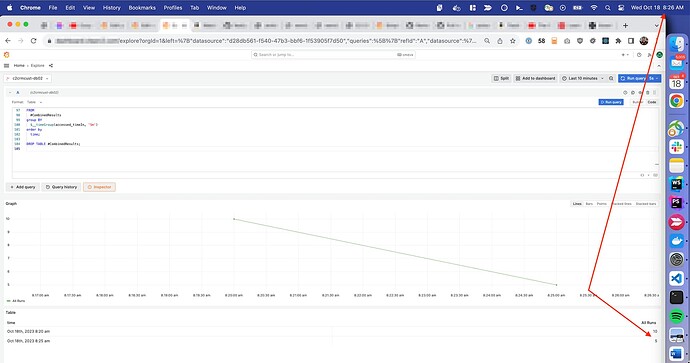
I think the time grouping is the issue. The latest group is never the full 5 minute window:
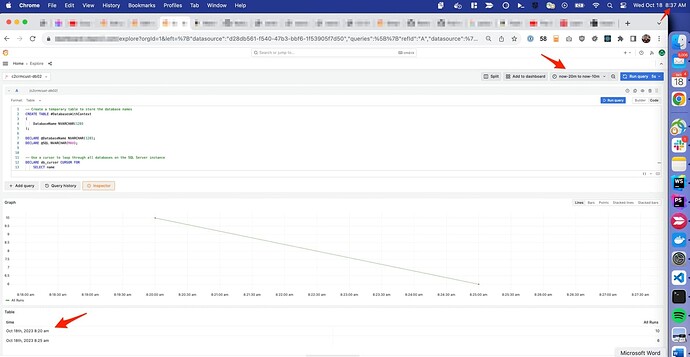
One minute later:
I thought i could change the window to like now-20m to now-10m but that continues to show 5 minute groups for the latest 5 minutes. i’m having a hard time figuring out why that is.
Are you grouping the start of the every 5th minute? For example, (09:00, 09:05), (09:05, 09:10), or is the grouping relative to the time of the query? For example (09:01, 09:06), (09:06, 09:11)?
it’s every 5th minute. I’m just using grafana’s built-in functions though which gets expanded to this:
SELECT
        FLOOR(DATEDIFF(second, '1970-01-01', accessed_timeIn)/300)*300 as time,
        count(*) as 'All Runs'
FROM
    #CombinedResults
group BY
        FLOOR(DATEDIFF(second, '1970-01-01', accessed_timeIn)/300)*300
order by
    time;


