I’ve configured the Windows collector to look at a couple test files that I have created, but it does not report any metrics regarding those files it seems. Alloy ver is 1.9.2, my config is:
The temp dir is not empty.
    prometheus.exporter.windows "vmStats" {
    	enabled_collectors = ["filetime", "cpu_info"]

    filetime {
    	    file_patterns =[
                "C:\\Temp\\*",

    	    ]
    	}
    }

    prometheus.scrape "example" {
      targets    = prometheus.exporter.windows.vmStats.targets
      forward_to = [prometheus.relabel.addLabels.receiver]

      scrape_interval = "30s"
    }

    prometheus.relabel "addLabels" {
    	forward_to = [prometheus.remote_write.default.receiver]

    	rule {
        action        = "replace"
        source_labels = ["__address__", "instance"]
        separator     = "/"
        target_label  = "host"
      }


      rule {
        action        = "replace"
        target_label  = "job"
        replacement   = "jobname"
      }

    }

    prometheus.remote_write "default" {
      endpoint {

    	url = "<had to remove the url but it cpu metrics from the above windows collector so should be fine"
      }

      external_labels = {
        appName = "app",
        nodeType = "FILETIMETEST",
      }
    }
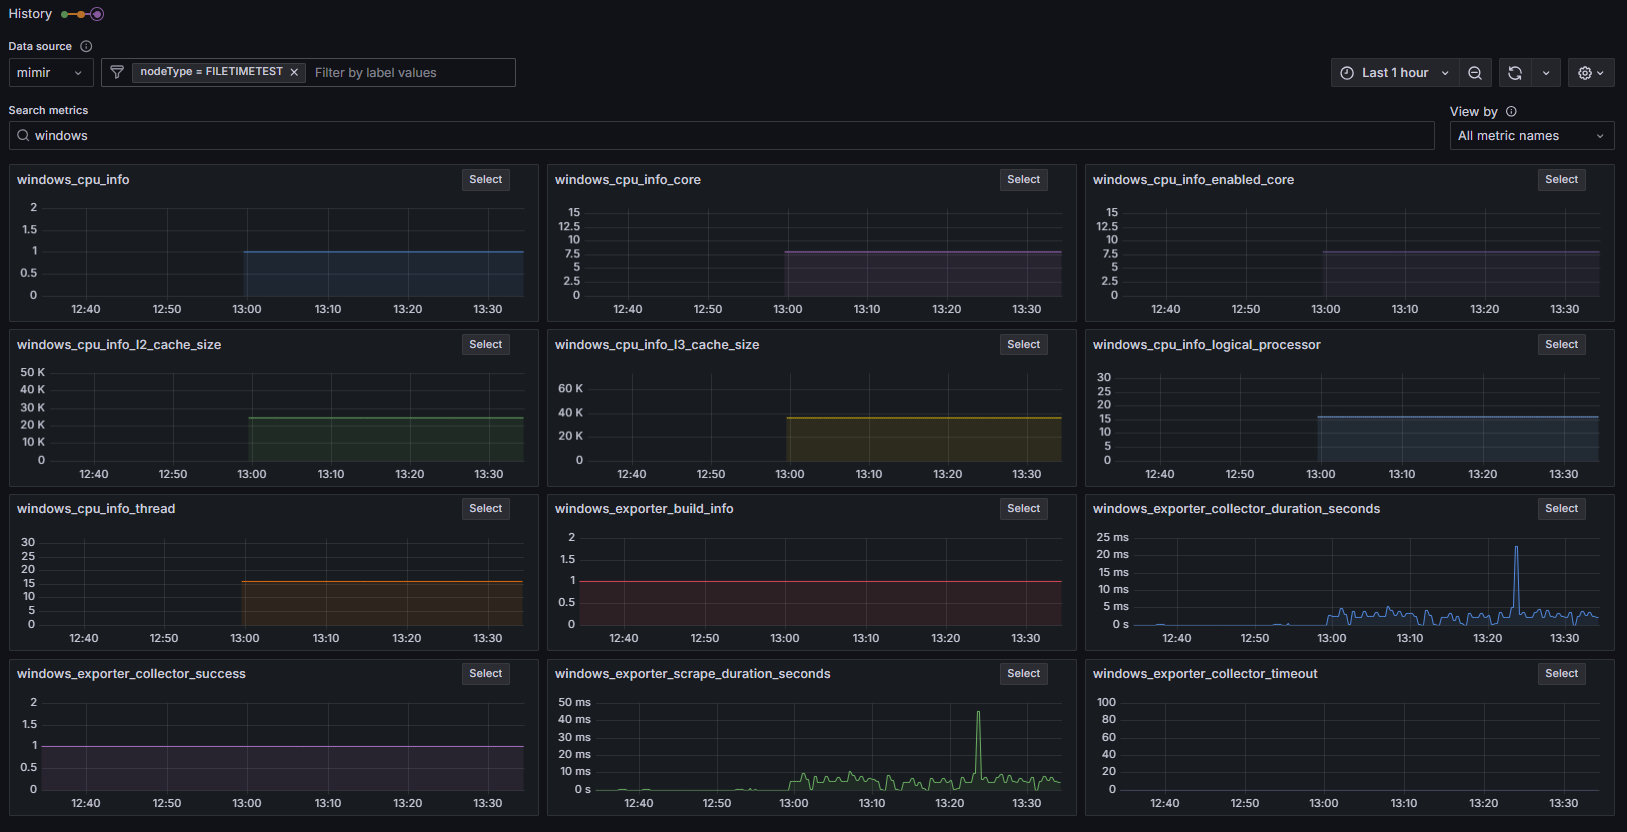
the scrape livedebug output does indeed see perf metrics regarding the filetime collector, but not info on the files themselves
sample: ts=1751628593977, labels={__name__="windows_cpu_info", architecture="9", description="Intel64 Family 6 Model 85 Stepping 7", device_id="CPU0", family="179", instance="HOSTNAME", job="integrations/windows", name="Intel(R) Xeon(R) Platinum 8259CL CPU @ 2.50GHz"}, value=1.000000
sample: ts=1751628593977, labels={__name__="windows_cpu_info_core", device_id="CPU0", instance="HOSTNAME", job="integrations/windows"}, value=8.000000
sample: ts=1751628593977, labels={__name__="windows_cpu_info_enabled_core", device_id="CPU0", instance="HOSTNAME", job="integrations/windows"}, value=8.000000
sample: ts=1751628593977, labels={__name__="windows_cpu_info_l2_cache_size", device_id="CPU0", instance="HOSTNAME", job="integrations/windows"}, value=24576.000000
sample: ts=1751628593977, labels={__name__="windows_cpu_info_l3_cache_size", device_id="CPU0", instance="HOSTNAME", job="integrations/windows"}, value=36608.000000
sample: ts=1751628593977, labels={__name__="windows_cpu_info_logical_processor", device_id="CPU0", instance="HOSTNAME", job="integrations/windows"}, value=16.000000
sample: ts=1751628593977, labels={__name__="windows_cpu_info_thread", device_id="CPU0", instance="HOSTNAME", job="integrations/windows"}, value=16.000000
sample: ts=1751628593977, labels={__name__="windows_exporter_build_info", branch="HEAD", goarch="amd64", goos="windows", goversion="go1.24.4", instance="HOSTNAME", job="integrations/windows", revision="30277f7", tags="builtinassets", version="v1.9.2"}, value=1.000000
sample: ts=1751628593977, labels={__name__="windows_exporter_collector_duration_seconds", collector="cpu_info", instance="HOSTNAME", job="integrations/windows"}, value=0.004370
sample: ts=1751628593977, labels={__name__="windows_exporter_collector_duration_seconds", collector="filetime", instance="HOSTNAME", job="integrations/windows"}, value=0.000000
sample: ts=1751628593977, labels={__name__="windows_exporter_collector_success", collector="cpu_info", instance="HOSTNAME", job="integrations/windows"}, value=1.000000
sample: ts=1751628593977, labels={__name__="windows_exporter_collector_success", collector="filetime", instance="HOSTNAME", job="integrations/windows"}, value=1.000000
sample: ts=1751628593977, labels={__name__="windows_exporter_collector_timeout", collector="cpu_info", instance="HOSTNAME", job="integrations/windows"}, value=0.000000
sample: ts=1751628593977, labels={__name__="windows_exporter_collector_timeout", collector="filetime", instance="HOSTNAME", job="integrations/windows"}, value=0.000000
sample: ts=1751628593977, labels={__name__="windows_exporter_scrape_duration_seconds", instance="HOSTNAME", job="integrations/windows"}, value=0.004370
sample: ts=1751628593977, labels={__name__="up", instance="HOSTNAME", job="integrations/windows"}, value=1.000000
sample: ts=1751628593977, labels={__name__="scrape_duration_seconds", instance="HOSTNAME", job="integrations/windows"}, value=0.005100
sample: ts=1751628593977, labels={__name__="scrape_samples_scraped", instance="HOSTNAME", job="integrations/windows"}, value=15.000000
sample: ts=1751628593977, labels={__name__="scrape_samples_post_metric_relabeling", instance="HOSTNAME", job="integrations/windows"}, value=15.000000
sample: ts=1751628593977, labels={__name__="scrape_series_added", instance="HOSTNAME", job="integrations/windows"}, value=0.000000
According to the docs
I should see metrics starting with windows_filetime but the only metrics I see is cpu related stuff.
Any and all help is appreciated! I’m not really sure if this is a bug or perhaps my mistake somewhere.