Hello all,
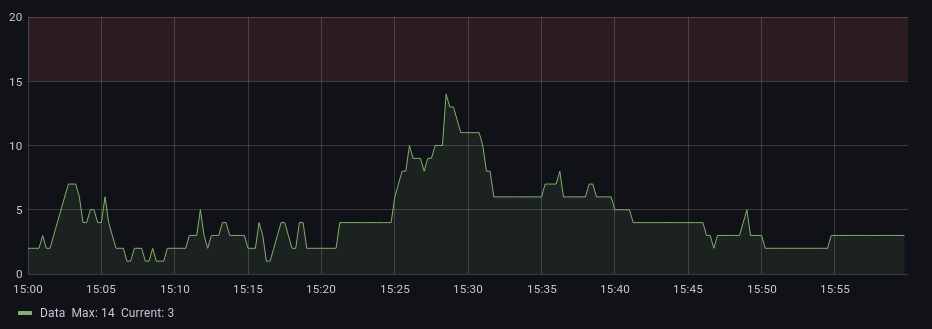
In the above graph, the max value is 14, and here I have displayed one hour worth of data. Now if I zoom out and display 24 hours data, the graph is as follows:

Here the max value becomes 11. From what I understand this happens because the data is averaged out with a wider range of data.
But I want to preserve the max data. (This graph is tracking utilisation of a resource, and the max utilisation is the important metric here).
How can I configure the graph so that irrespective of the time range selected, the max value is selected to display from a time window, instead of current average value of all the data points?
The data source I am suing is prometheus, and the query is sum(saturation_in_value{}) + sum(saturation_out_value{})
X.