Hi there,
When I go to “Explore”, I can really easily do exactly what I want:
So basically a nice bar graph with the log level with different color.
There are also the list of logs in the bottom, but I don’t care about that.
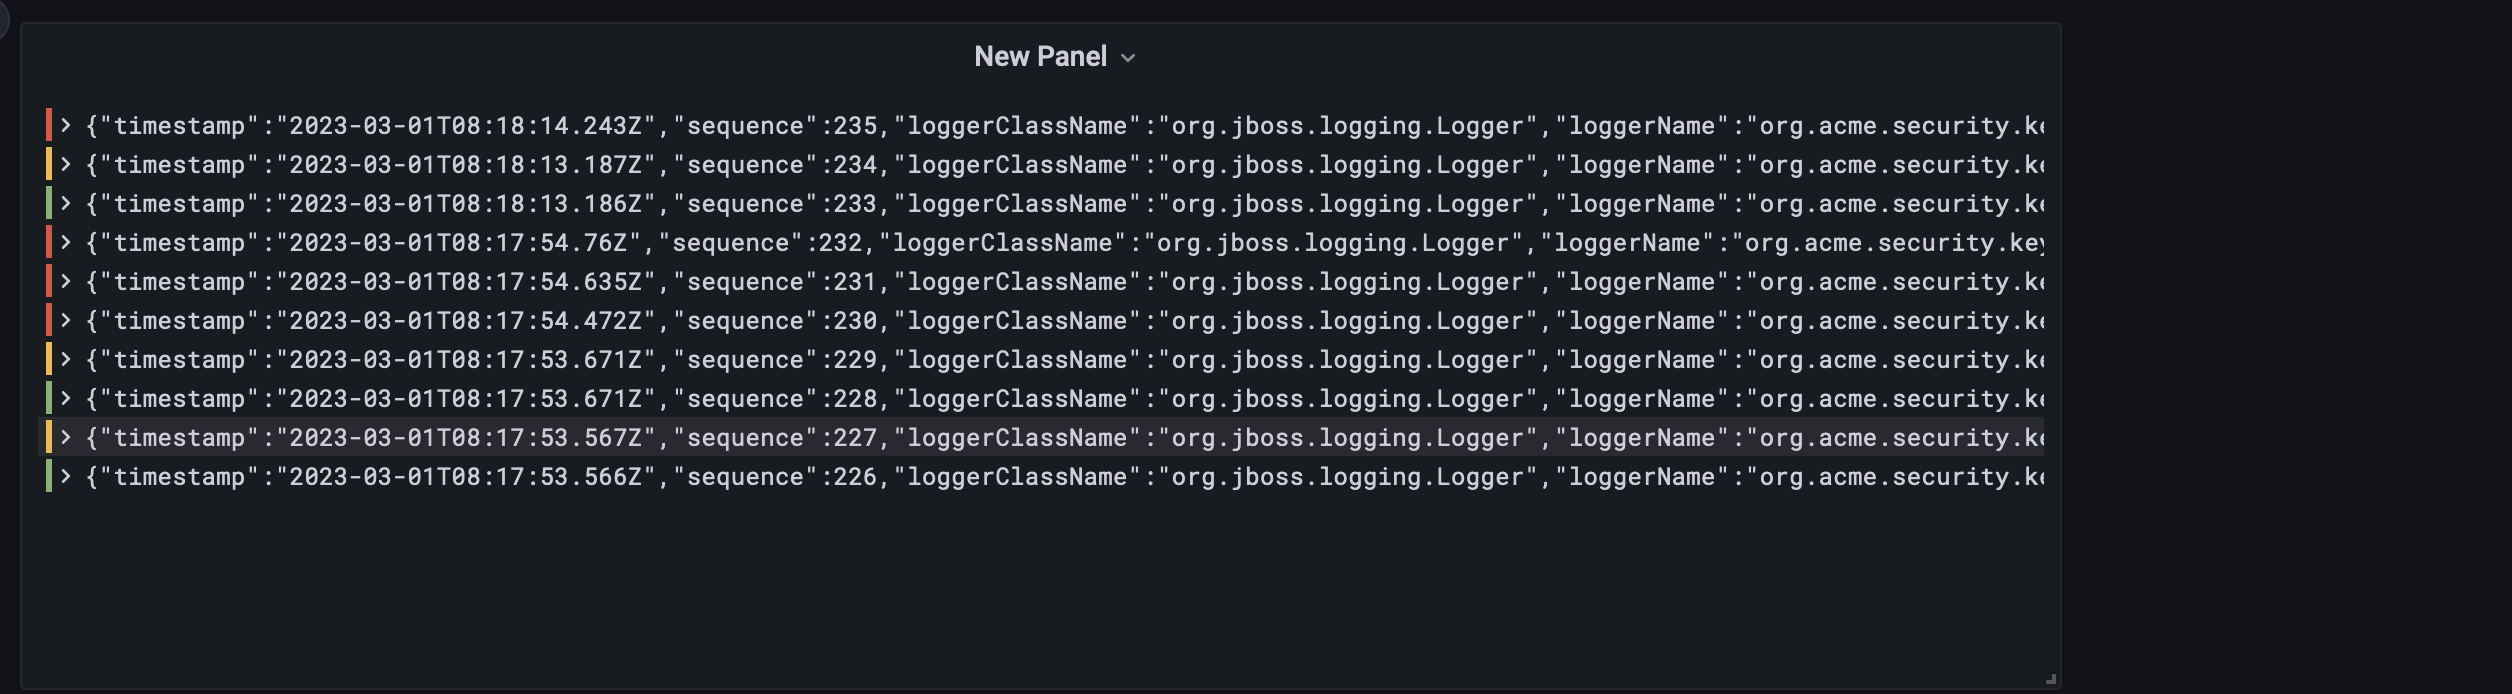
However, when I save this view with “Add to Dashboard”, the same panel in the dashboard view looks different:
Now I only have the list of logs, no graph. I only want the graph !
Is there a way to change that ?
If not, how can I achieve the same view with a custom panel ?
Thanks !
@usman.ahmad thanks for your answer; here is the Github issue:
opened 12:02PM - 01 Mar 23 UTC
closed 02:20PM - 01 Mar 23 UTC
area/dashboard
type/works-as-intended
area/explore
datasource/Loki
triage/needs-confirmation
**What happened**:
I am trying to set up some dashboard for my log monitoring… .
When I go to “Explore”, I can really easily do exactly what I want:

So basically a nice bar graph with the log level with different color.
There are also the list of logs in the bottom.
However, when I save this view with “Add to Dashboard”, the same panel in the dashboard view looks different:

Now I only have the list of logs, no graph. The graph should also be there.
**What you expected to happen**:
When we save a panel from the the Explore feature, the dashboard should have the same view (with the graph)
**How to reproduce it (as minimally and precisely as possible)**:
Explore > Data Source: Loki > extract some logs (example {name="backend"} |= `` | json | __error__=``) > add to dashboard
**Anything else we need to know?**:
Here is the original question on the community forum:
https://community.grafana.com/t/panel-view-with-explore-not-the-same-when-added-to-dashboard/82864
**Environment**:
- Grafana version: 9.2.5
- Data source type & version: Loki
- OS Grafana is installed on:
- User OS & Browser: Macos, Firefox
- Grafana plugins:
- Others:
Hi @piettes2010 ,
Welcome to the
We are excited that you joined our OSS community. Please read about some of the FAQs in the community
Thanks for opening this post. To me, it looks like a bug because this only happens in the Loki Datasource while in the case of Prometheus datasource (inside Explore view) which uses TimeSeries Panel as default, the “Add to Dashboard” does work correctly.
We would appreciate it if you can open a bug report about this in our official GitHub repository using this link .
Provide all the information (you can simply copy/paste your data + screenshot from here to there).
Lastly, paste the link to your GitHub issue here so that all other community users can also track it (i will also add more details too).
piettes2010:
Now I only have the list of logs, no graph. I only want the graph !
Is there a way to change that ?
If not, how can I achieve the same view with a custom panel ?
You have to create that part manually, Simply go to Dashboard and select e.g. Bar Chart panel visualisation.
Select the Datasource as Loki, then copy and paste the Loki Query that you used in the Explore module and you should see the same result.
I couldn’t figure it out with this way (using Bar Chart).
But I could get something good enough with time series and 3 queries:
count(rate({name="backend"} | json | __error__=`` | level = `ERROR` [$__interval]))
count(rate({name="backend"} | json | __error__=`` | level = `WARN` [$__interval]))
count(rate({name="backend"} | json | __error__=`` | level = `INFO` [$__interval]))