Hello
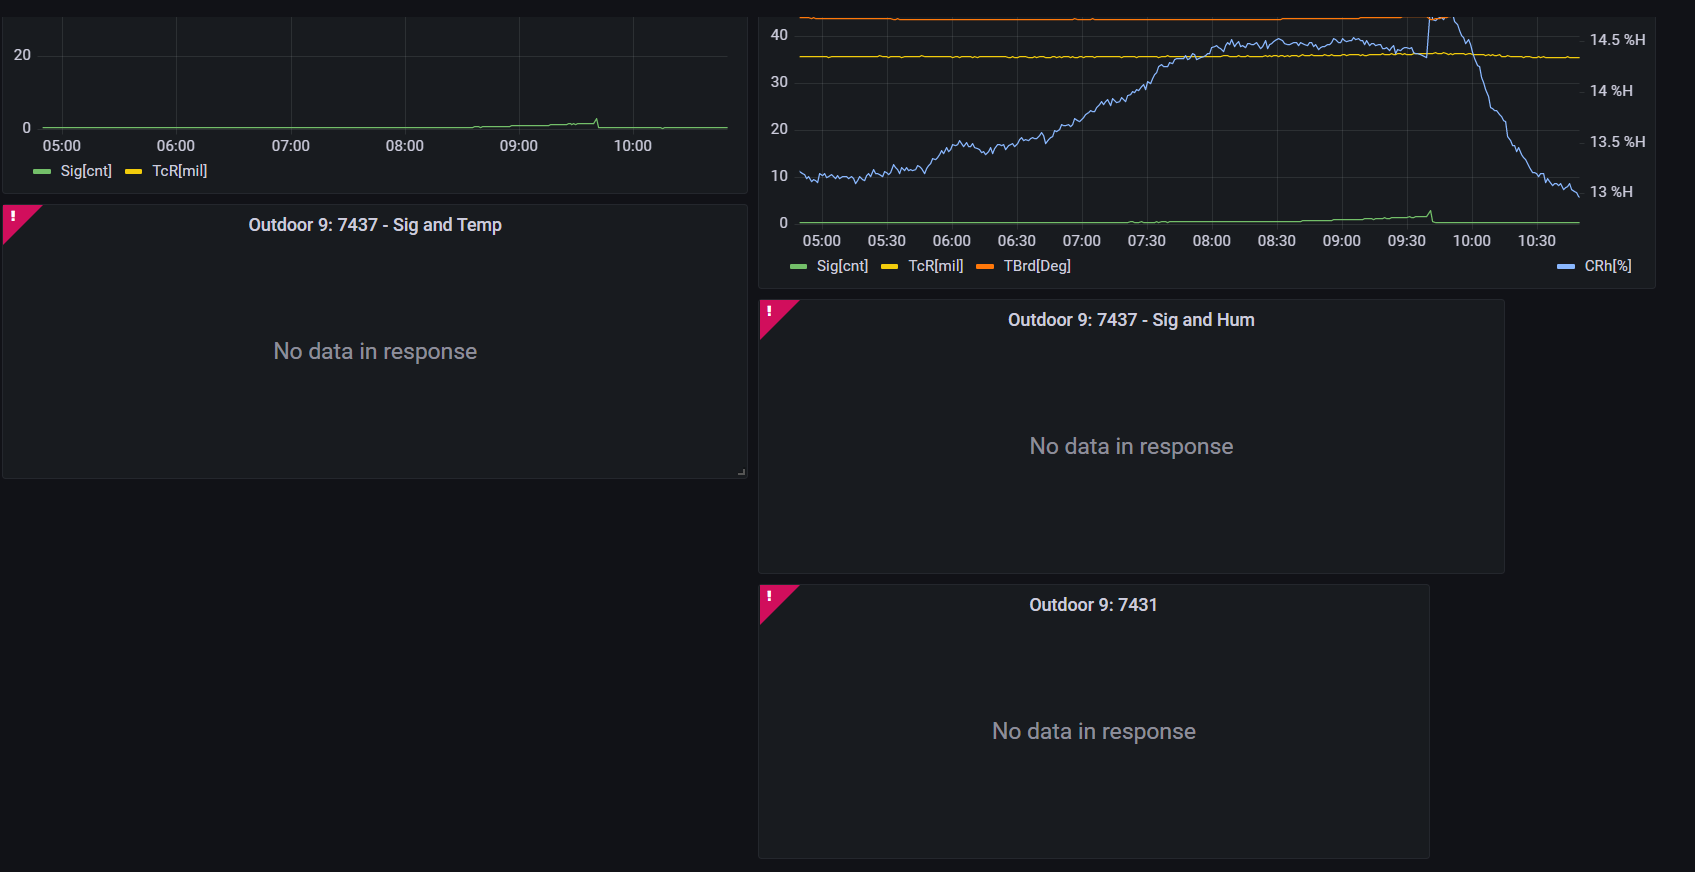
Upon logging in, the dashboard shows. Usually most graphs have “No Data in Response” in the middle, and a red warning sign in the corner. When I hover over the warning sign, it says “Metric Request Error”. After refreshing, some graphs show up, others don’t. Which ones show up and disappear is kind of random.
For example first refresh 0/4 panels show data. A few minutes later panels A & C show data. Some time after Panel A & D show data but B & C show the error. etc.
I’m using the CSV plugin (by Marcus Olsson, not sure if that’s relevant)
Screenshots attached:
I read through some of the other threads but can’t quite match up the problem from this plugin to the others. I don’t get the “Metric Request Error” when I go into the Data Source section, only when making and seeing panels on the dashboard.
I tried removing the “http://” from the URL that’s fed into the CSV Data Source, but that instead created its own error, so I changed it back.
Is there anything else I can try? Any thoughts on why it’s so random?
Did you create these queries and these panels/dashboards, or did you import a dashboard someone else made?
We set up the panels/dashboards ourselves. To be fair this is our first dashboard and we’re kind of just testing things out. Maybe we forgot to switch on/off a setting or something. In other words, we know next to nothing and would appreciate any help.
If you lookin the developer tools under the network tab, do you see anything when a query fails?
Thanks for the tip. Took me a while to find the Dev Tools, but here’s a screenshot of what it shows when I refresh the dashboard page with DevTool/Network running.
This looks like a query problem. I would try manually connecting to your datasource to help troubleshoot where the problem is 
Hi Matt! Thanks again for following up on this! How can we go about doing that? When you say manually do you mean without the plugin? Or just visiting the hyperlink (webpage) where the data is directly?
@info5dc4 how many rows of data are in these csv files? If you click the dropdown for a broken panel and then inspect → Query, do you see an error message? (you might have to press refresh).
Perhaps this is a loading / caching issue. Sounds maybe related to this recent issue in the CSV Plugin repo, @marcusolsson?
Metric request error along with a 500 from the query request typically mean that there’s an error in the backend plugin running on the server.
Could you check the Grafana server logs for clues maybe?
@anon70503803 sorry for the late reply. I’ve been away and since coming back I haven’t been able to catch the same error (which is a good thing). I also tried it on a different browser now. It gave the error for 1/10 panels, and even then, as soon as I went to “inspect”–>“query” the error disappeared. I had encountered this before, where if I refreshed the page a few times the problem would solve itself.
The number of rows is between 10k-100k. Different devices are sampling every minute, some have been running for a couple of weeks, others for a couple of months. But I also remember getting this for ones running a few hours.
@marcusolsson thanks for jumping in to help! How do I find/access the Grafana server logs?