I’m trying to get the max container memory usage as a percentage value over a time range, and I’m quite close, but my current query seems to fall short.
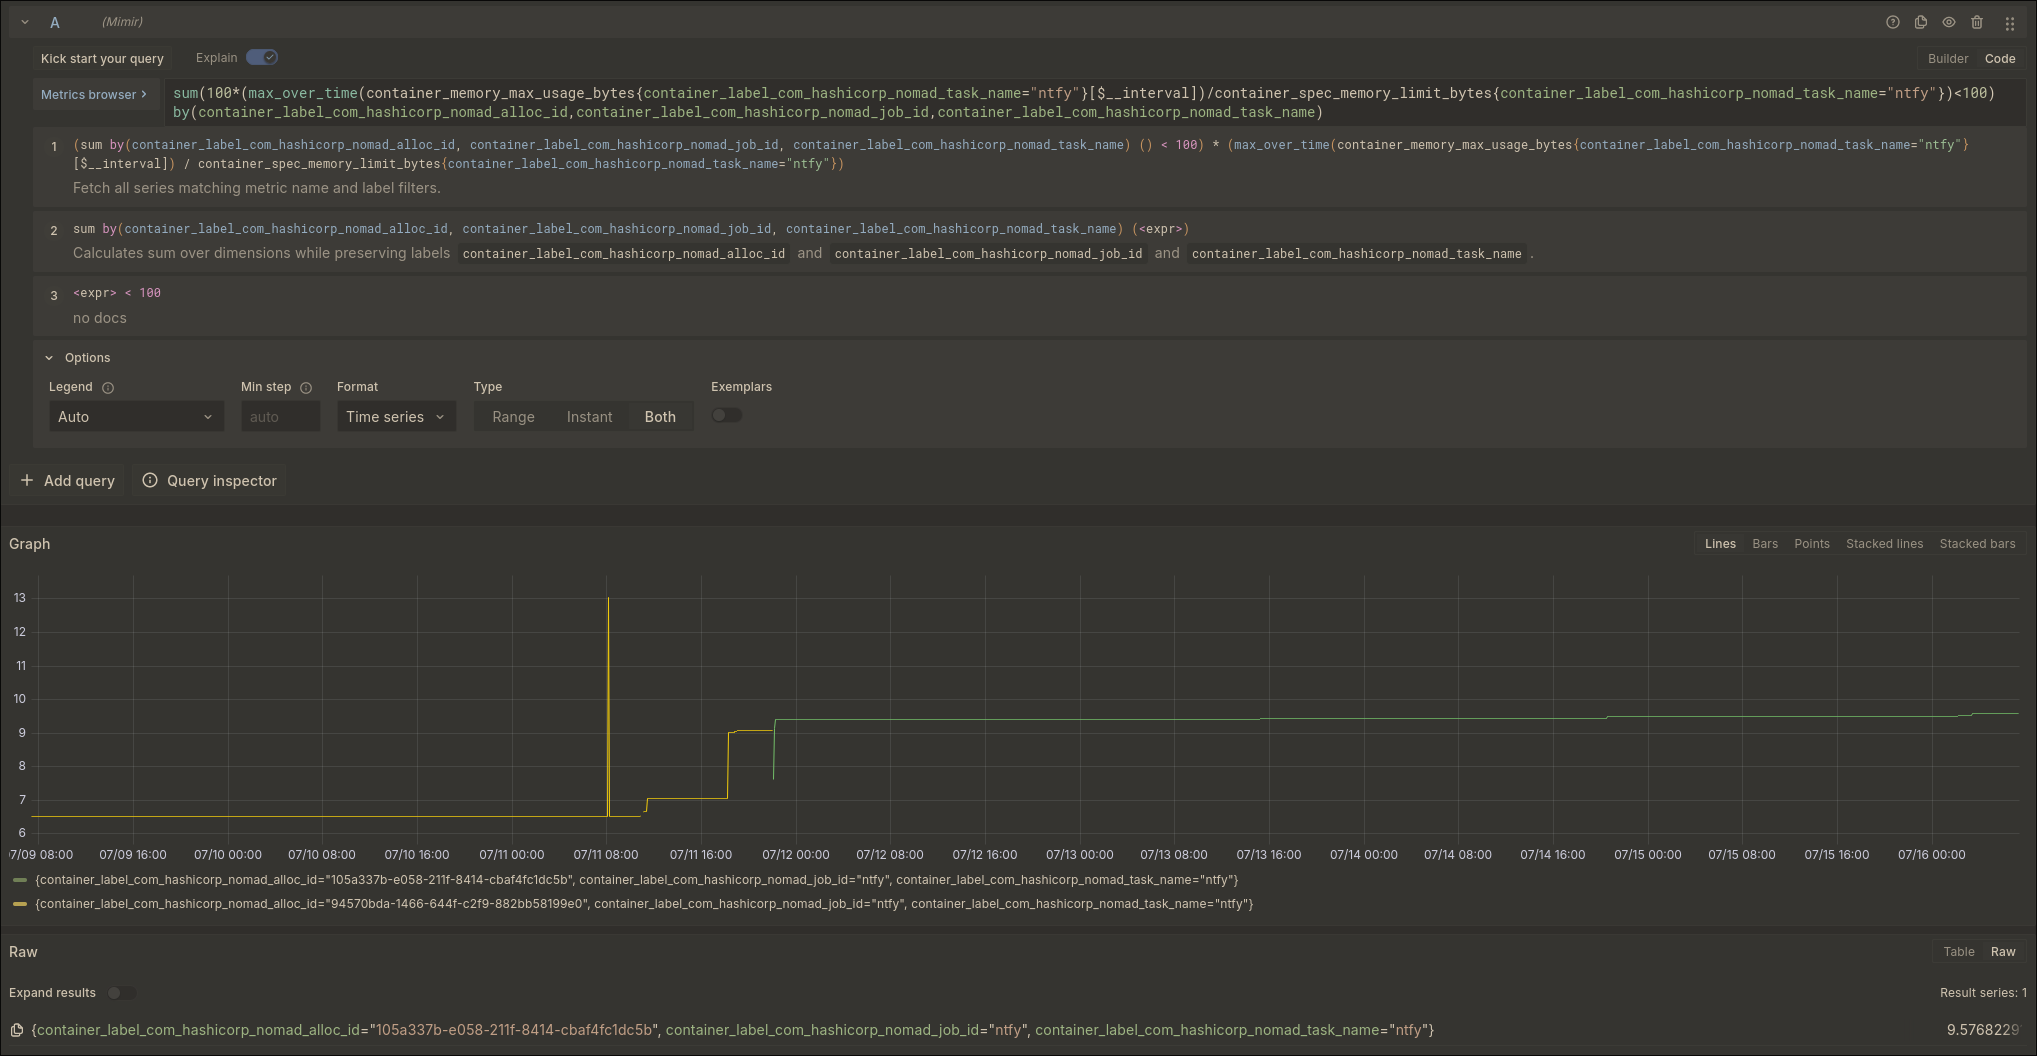
As can be seen in the image below I’m getting two time series for memory usage by ntfy, and a single max value as a result. The problem is that the max value shown in the table is not the actual maximum found in the time range, the highest value is 13%, which is in the series with the yellow line. I assume this has something to do with the fact that the yellow series ends and is replaced by the green one, i.e. the ntfy container was replaced. But why is the query result only considering values from the green series and not values across the entire time range?
The query in code for reference:
sum(100*(max_over_time(container_memory_max_usage_bytes{container_label_com_hashicorp_nomad_task_name="ntfy"}[$__interval])/container_spec_memory_limit_bytes{container_label_com_hashicorp_nomad_task_name="ntfy"})<100) by(container_label_com_hashicorp_nomad_alloc_id,container_label_com_hashicorp_nomad_job_id,container_label_com_hashicorp_nomad_task_name)