Hi people!
Let me expose my problem using the template.
-
What Grafana version and what operating system are you using?
Latest Grafana version v10.4.0 and running in a Docker container. -
What are you trying to achieve?
As an image is worth a thousand words:
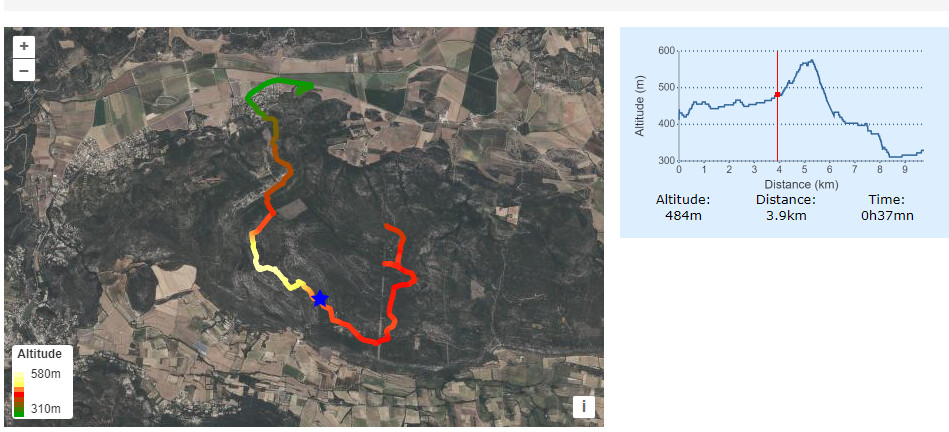
What I’m trying to achieve is to link a measure, for example ping, to a specific position (given latitude and longitude) in a Geomap dashboard with route layer. As far as now, this is what I have:

I can mark the position without problems, the numbers are just the ping at that location (made by me for testing). However, what I want to try is to link the dashboard I have for pings to that Geomap dashboard, so when I hover over a point of the ping dashboard, it displays me in the Geomap dashboard where it was. This is the dashboard of pings:

-
How are you trying to achieve it?
Tried with different options within Geomap panel, but no success. -
What happened?
– -
What did you expect to happen?
– -
Can you copy/paste the configuration(s) that you are having problems with?
-
Did you receive any errors in the Grafana UI or in related logs? If so, please tell us exactly what they were.
-
Did you follow any online instructions? If so, what is the URL?
I’ve just followed the documentation about Geomap in the Grafana website + the link that’s in that section → ol-ext: GPX flow style
Feel free to ask anything.
Btw, sorry for the English. Thanks in advance!