Greetings, i’ve installed Grafana with InfluxDB as datasource that is filled in by Icinga2 monitoring tool. I’ve also used a predefined dashboard icinga2-influxdb-host from here: https://grafana.com/dashboards/1572
I’ve run into problem that various monitored hosts have various services (for example somewhere we don’t monitor mem or load). This leads to inconsistent displaying of units in service rows. For example i set units correctly on one host for mem to be in bytes and for cpu to be in % but when i switch to another host that has different layout of services in rows, these units are now mapped to different services, e.g. i get load in bytes or % etc.
Is there a way to adjust the template to react to changes in these services and assign to each service correct units? Currently in the dashboard templating definition there are these 2 variables:
$hostname   SHOW TAG VALUES WITH KEY = "hostname"
$service    SHOW TAG VALUES WITH KEY = "service" where hostname =~ /^$hostname$/
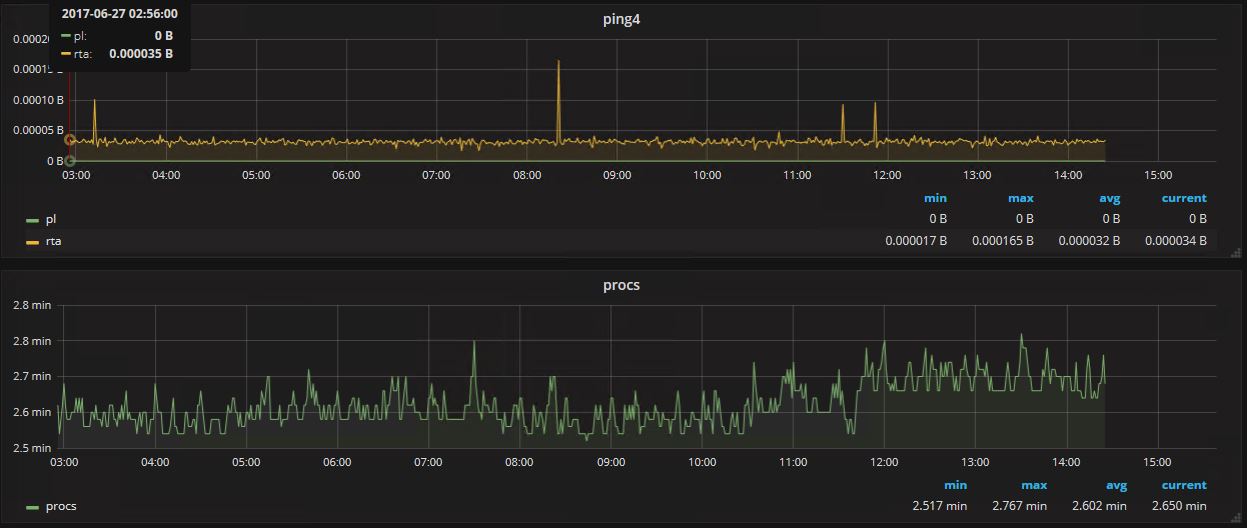
Here is a screenshot what i mean, i switch to another host and ping has units in bytes while procs are in minutes. Do i have to somehow create a list of services and compare it against the string and set the units on axes accordingly? Is there a way to do it directly in the metrics editor? Thanks for help or for pointers into documentation on how to correct it.