PaulM
July 1, 2025, 10:20am
1
Hi!
import { browser } from 'k6/browser';

export const options = {
    scenarios: {
        ui: {
            executor: 'shared-iterations',
            options: {
                browser: {
                    type: 'chromium',
                },
            },
        },
    },
};

export default async function () {
    const page = await browser.newPage()

    await page.goto('https://www.yahoo.com', { 'timeout': 60000, 'waitUntil': 'load' })
    await page.close()
}
When it’s working, I get a message:
WARN[0009] sid:3C2B1984B8A0AF4E84E8891C12F9729F
 tid:099276E5E359BD098F858C44A5D9DDC3
 bctxid:44A373C710809D6C2DCA39BFAD550C08 bctx nil:false,
unknown target type: "service_worker"  category="Browser:isAttachedPageValid" elapsed="0 ms" source=browser
After it’s work, I see a message with total results. But in prometheus, I see that an error is sent instead of the data: chrome-error://chromewebdata/.
Should data be sent to prometheus when there is a warning?
PaulM
July 1, 2025, 2:48pm
2
Hi @inancgumus !
ankur
July 18, 2025, 8:51am
4
Hi @PaulM ,
I’ve tried to replicate the issue you are seeing, but i’m not able to at the moment. Here’s what I’ve done to try to recreate the problem:
Used this compose file to start a local instance of prometheus and grafana; note that I don’t actually need grafana.
Ran the compose file with docker compose -f prom-grafana.yaml up
Copied the script exactly into test.js.
Ran k6 with K6_PROMETHEUS_RW_SERVER_URL=http://localhost:9090/api/v1/write k6 run -o experimental-prometheus-rw test.js
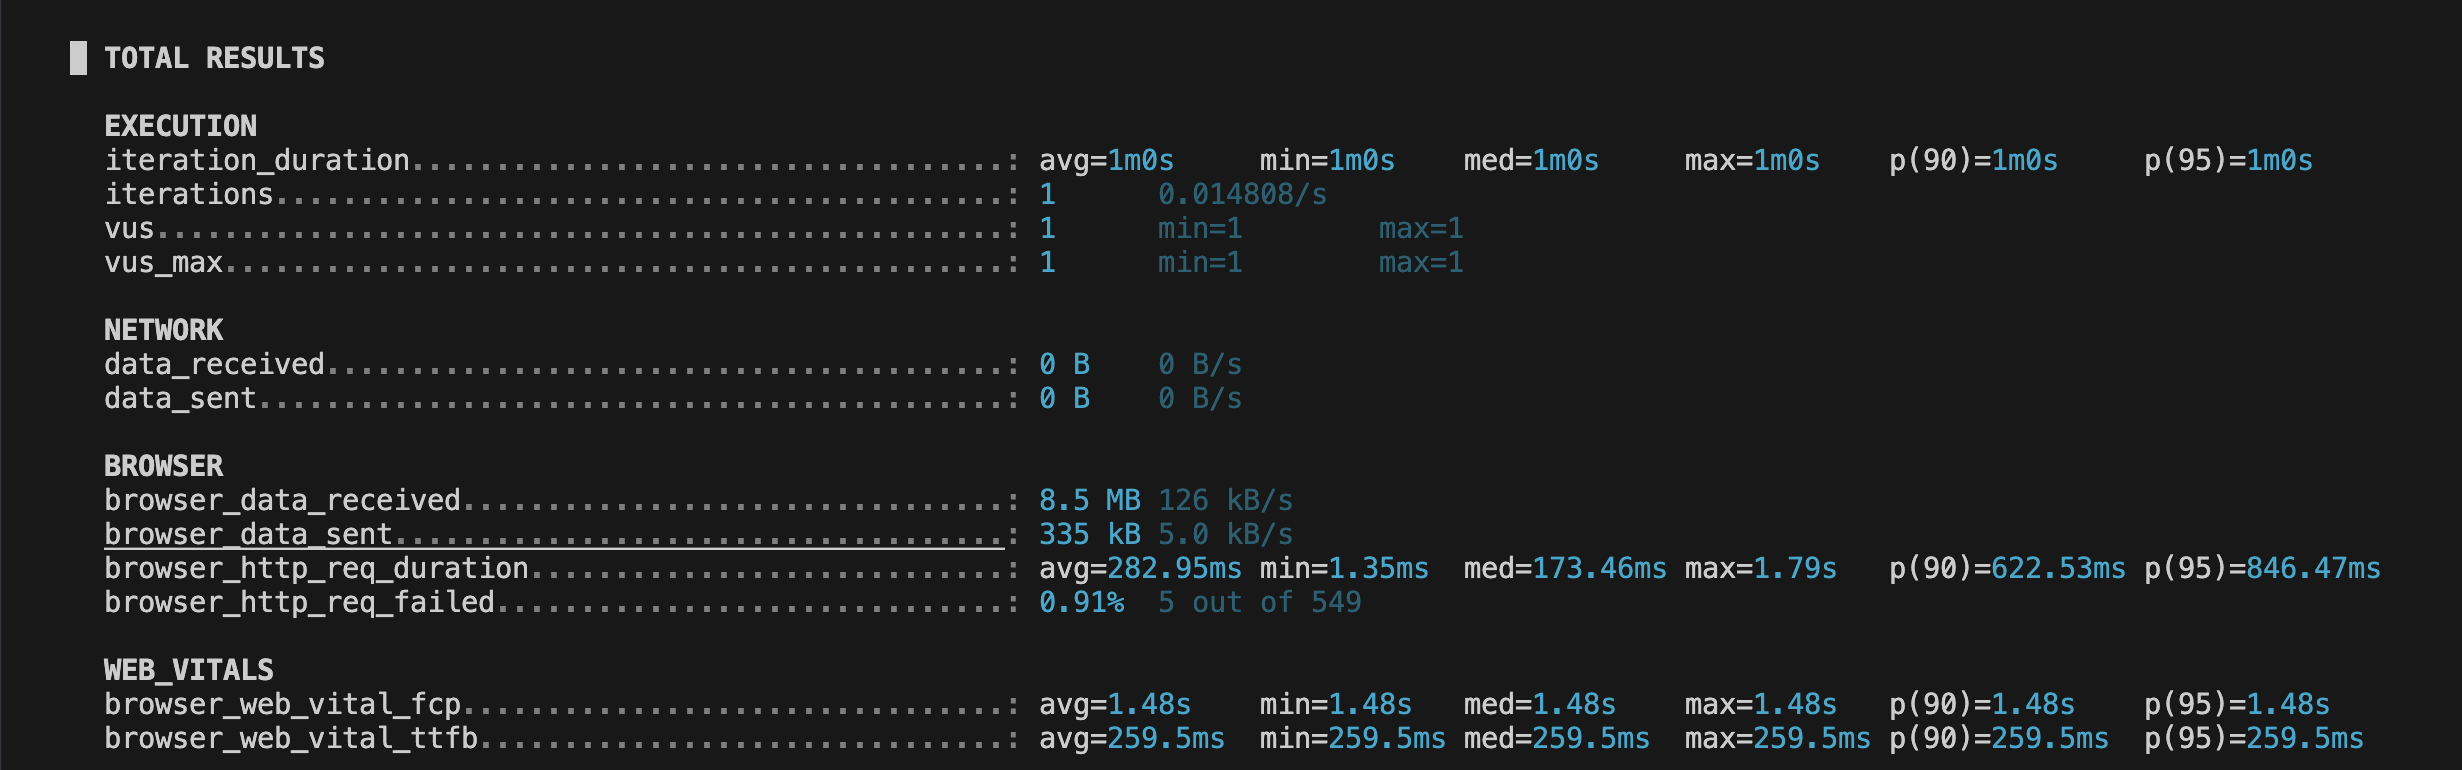
The results from the test run are:
  █ TOTAL RESULTS

    EXECUTION
    iteration_duration...................................: avg=911.47ms min=911.47ms med=911.47ms max=911.47ms p(90)=911.47ms p(95)=911.47ms
    iterations...........................................: 1      0.708924/s
    vus..................................................: 1      min=1       max=1
    vus_max..............................................: 1      min=1       max=1

    NETWORK
    data_received........................................: 0 B    0 B/s
    data_sent............................................: 0 B    0 B/s

    BROWSER
    browser_data_received................................: 574 kB 407 kB/s
    browser_data_sent....................................: 9.4 kB 6.6 kB/s
    browser_http_req_duration............................: avg=69.16ms  min=15.04ms  med=58.66ms  max=233.63ms p(90)=144.83ms p(95)=182.79ms
    browser_http_req_failed..............................: 0.00%  0 out of 15

    WEB_VITALS
    browser_web_vital_cls................................: avg=0        min=0        med=0        max=0        p(90)=0        p(95)=0
    browser_web_vital_fcp................................: avg=616ms    min=616ms    med=616ms    max=616ms    p(90)=616ms    p(95)=616ms
    browser_web_vital_lcp................................: avg=616ms    min=616ms    med=616ms    max=616ms    p(90)=616ms    p(95)=616ms
    browser_web_vital_ttfb...............................: avg=514.4ms  min=514.4ms  med=514.4ms  max=514.4ms  p(90)=514.4ms  p(95)=514.4ms
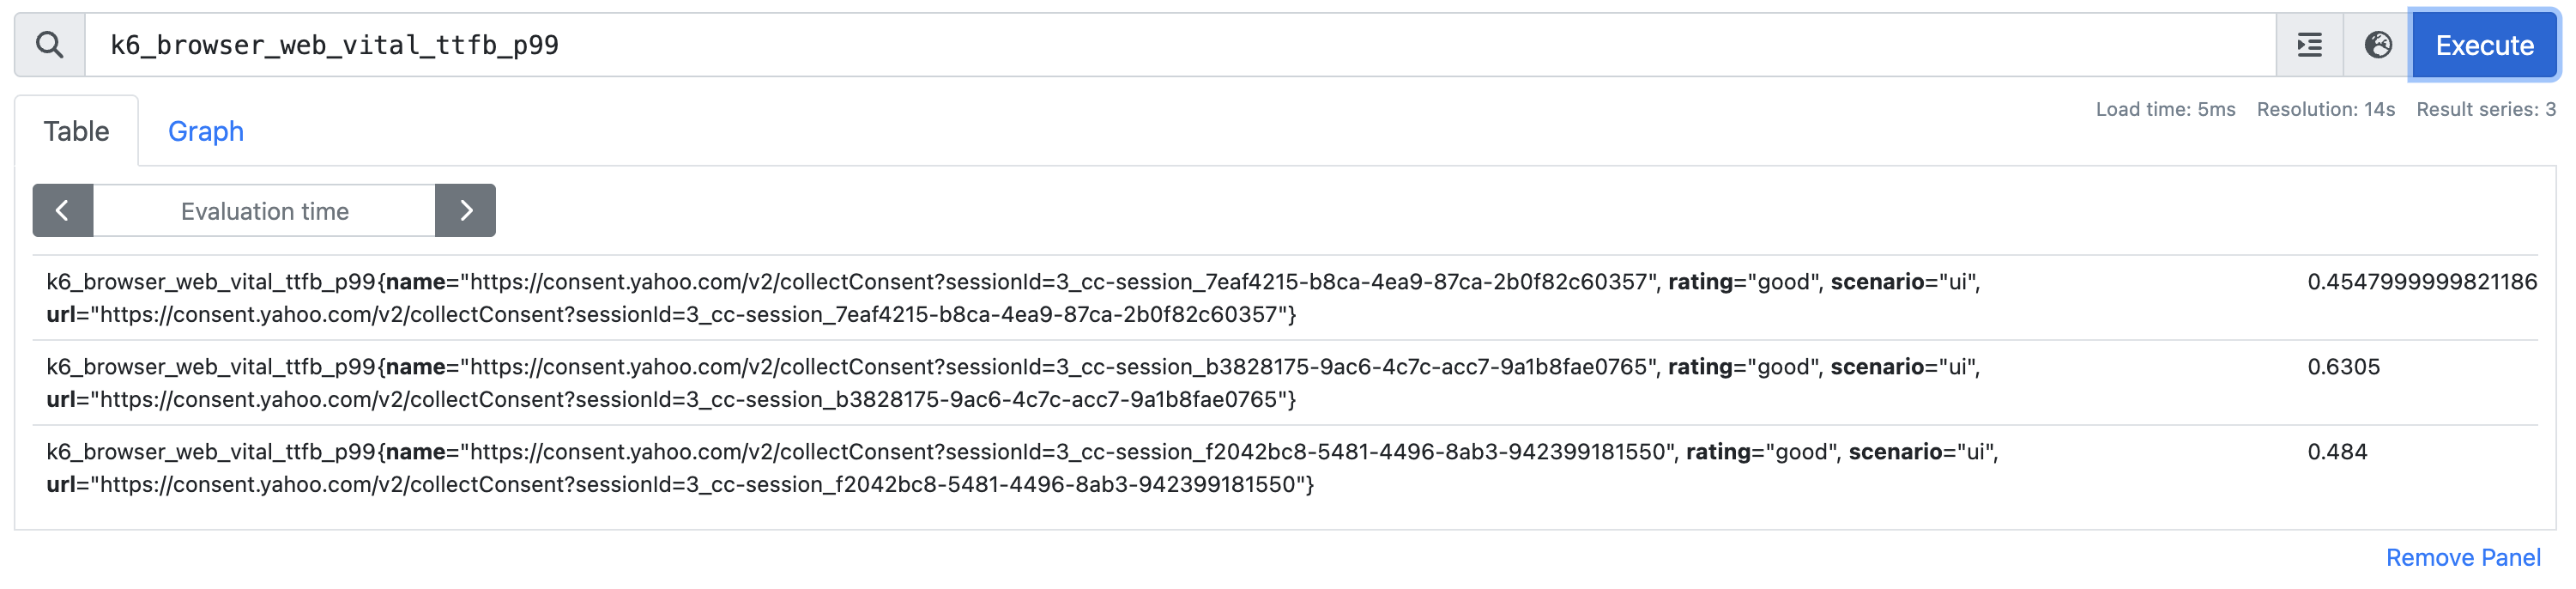
I didn’t see any errors with service_worker.
Here’s a screenshot of the only ttfb data I’m seeing after a few test runs:
Could it be a network issue?
Best,