I’m running selenium in github actions and it produces a json file with the results of the test. The format is jest.
How can I ingest it into grafana cloud ?
would this be a one time thing where you want to quickly visualize the content of the json file or a continuous test and upload process?
I’m running a GitHub action scheduled once an hour. It spins a couple of dockers and run few selenium side runner Tests (on live site). It creates a jest test result file (it can also be a junit XML format). Id like to upload that file every time the tests runs… (Just to clarify, the runner in GitHub runs just for 2 minutes and then it stops)
1 Like
basically you cant import any data into grafana as it is visualization tool. but you can use plugin such as infinity to copy and paste the json/xml content and visualize. can you share some sample data?
unless you want to ingest the test data into a database during testing.
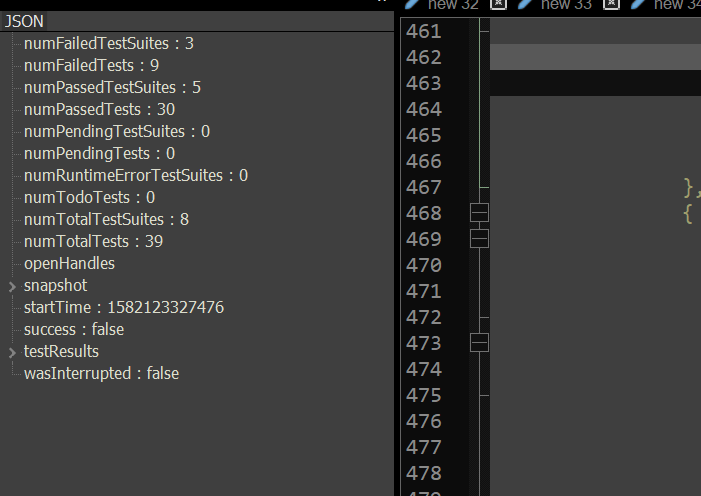
For what I understood , grafana cloud is grafana (the visualisation tool) plus other databases (for logs, time series etc…)… Here an example: https://docs.calliope.pro/assets/example_jest_report.json
1 Like
from this data what do you want to visualize in which visualization?
Tests failed would be a good start… So I can create an alarm (means, the site is broken…)


This looks great… But how did you upload it ?
Copy paste the json data into the data area shown in 1st image on my last post. You can also use the json URL you posted and spits same result
one step back to the original question… how do I do it programmatically? having a json file, how to upload it into grafana cloud…
That’s beyond grafana. You will have few choices but the following is probably best approach
Import the final json into a time series database such as influxdb, mysql etc
Or write directly to db from jest test units.
Then point grafana to this data source.
Or auto provision the whole dashboard after each test. You cant upload a json file into grafana
this is what I’m learning as I type… I’m interested in “grafana cloud” which includes Gafana AND Prometheus…
Grafana Cloud is a composable observability platform that packages together metrics, logs, and traces with Grafana. It leverages the best open source observability software – including Prometheus, Loki, and Tempo – without the overhead of having to install, maintain, and scale your own observability stack.
I’ve found that apparently, to upload json I should be using grafana agent… I keep investigating…
ok… found it
1 Like