Hello! According to your screenshot you don’t have a label with a name “instance”. May be you can try this?
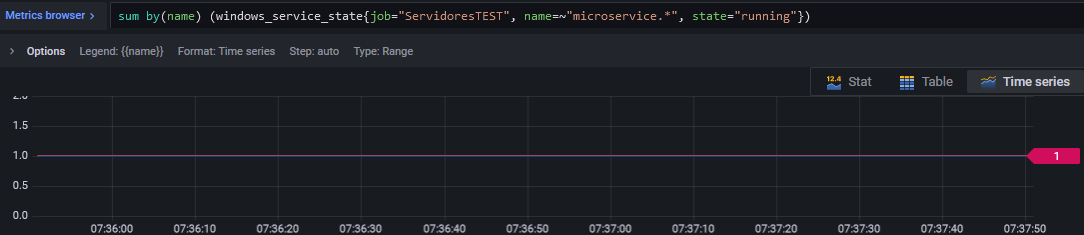
Servicio:{{ $labels.name }} Estado de servicio: {{ $values.D.Value }}
nope ![]()

Hi @rodrigoparavano,
If you want to get label value from query then you can do with:
{{ $values.<queryname>.Labels.<tag> }}
For example:
On server {{ $values.B.Labels.host }} port {{ $values.B.Labels.port }} is closed (not listening).
would print:
On server monitoringserver port 8282 is closed (not listening).


Bonus:
Dynamic Severity labels
You can also do more advanced stuff like dynamic label value setting based on query values. For example you can set custom label Severity which would have next values:
Fatal for values >= 98
Critical for values >= 95 AND < 98
Warning for values >= 90 AND < 95
NoData if $value.B does not exist
Severity label formula:
{{ if $values.result }}{{ if (ge $values.result.Value 98.0) }}Fatal{{ else if and (lt $values.result.Value 98.0) (ge $values.result.Value 90.0) }}Critical{{ else if and (lt $values.result.Value 90.0) (ge $values.result.Value 85.0) }}Warning{{ else }}None{{ end }}{{ else }}NoData{{ end }}

Note that here my query in grafana alert is called result. Be aware that every time new severity label is created (for example Severity=Critical) a new alert check will be created and the alert with old Severity label (e.g. Severity=Warning) will be resolved with "grafana_state_reason": "MissingSeries". Newly created check would first go to pending (if you set it) and then to alerting state.
In order to avoid quick changes of Severity label (and thus avoiding alerts being in pending mode) I usually use mean function in my query with time range of 5 minutes (mean of values over larger time range provides more stable number but it is slower at alerting). Also, I always first round numbers (with Math expression) and then perform Threshold expression over rounded numbers. Reason behind is also to avoid fast label changing.
Last thing to mention is part of formula which checks if data in result variable exists:
{{ if $values.result }}........{{ else }}NoData{{ end }}
This is used so that when data is missing (e.g. agent has crashed or somebody stopped it) you get Severity=NoData instead of broken formula like on next picture:

Hope this helps. ![]()
Best regards,
ldrascic
1 Like


Hi! It looks like you are using Classic Conditions, which because can have multiple conditions (i.e. an average, a min, and a max all together) you need to append the index of the condition too. For example, in your screenshot you would use:
{{ $values.D0.Labels.name }}
to get the name label for query A.
1 Like
thanks to everyone!
i stop using classics condition and use reduce and math, its more easy!
my last cuestion is how to use math condition when i have more than one expression to evaluate.I need to evaluate with “OR”. for example:
$E < 1 or $F < 1 or $G < 1

You use || for or and && for and
1 Like
Just to expand what @georgerobinson said…
If for example you want to trigger an alert any time the value of B is less than 30 or more than 60, then you would write as $B < 30 || $B > 60 :
1 Like


As this topic interests a lot of members, I created a post here to share examples of alerting templates.
Feel free to give your feedback in answers there.
1 Like
Hi Guys,
This is about grouping and displaying similar alerts.Preformatted text
I have below message template
{{ define “myalert” }}
[##{{.Status}}] {{ .Labels.alertname }}
{{ if gt (len .Annotations) 0 }}
{{ range .Annotations.SortedPairs }}
{{ .Name }}: {{ .Value }}
{{ end }}
{{ end }}
{{ end }}
{{ define “mymessage” }}
{{ if gt (len .Alerts.Firing) 0 }}
{{ len .Alerts.Firing }} firing:
{{ range .Alerts.Firing }} {{ template “myalert” .}} {{ end }}
{{ end }}
{{ if gt (len .Alerts.Resolved) 0 }}
{{ len .Alerts.Resolved }} resolved:
{{ range .Alerts.Resolved }} {{ template “myalert” .}} {{ end }}
{{ end }}
{{ end }}
I tried to keep it simple and actual labels/values are coming from annotations
Here is an example, current output
[##firing] swap-gr-3gb
summary: VM - fr1, SwapUsed - 3.073 GB, vc - usvfa_net,
[##firing] swap-gr-3gb
summary: VM - us1, SwapUsed - 4.481 GB, vc - usv_net,
How to avoid this repeated “##Firing swap-gr-3gb” and group similar alerts into one block like below
[##firing] swap-gr-3gb
summary: VM - fr1, SwapUsed - 3.073 GB, vc - usvfa_net,
summary: VM - us1, SwapUsed - 4.481 GB, vc - usv_net
Any thoughts please
I’ve been reading the doc and doing things with templates (struggling a bit I admit) but being blocked with something I found this thread and maybe someone has the answer to my problem …
I would like to add in the alert template some message containing the timestamp of the alerts. I tried to access the {{ .StartsAt }} value from the alert but it does not work.
To understand my problem, consider the following use case:
- 2 different alerts, two different topics (like presence of HTTP 500 on API and number of ERROR logs > 0)
- for each I have a command line tool to see logs that can be
investigate http500 --ts 1677774506orinvestigate errorlogs --ts 1677774506. Or it can be a link to some dashboard like “https://mydomain/dashboard/http500?ts=1677774506”
How can I get that timestamp value (in the example 1677774506) that could be used to run the command line tool with the right data/time just copy pasting the command or in a link to some dashboard?
Hi,
I currently have my alerts printing out like this
DC: x
 Cluster : a memory usage at some value
DC: x
  Cluster: b memory usage at some value
DC: y
  Cluster: a memory usage at some value
I instead want it grouped so the clusters are under that same DC like
DC: x
 - Cluster: a memory usage at some value
 - Cluster: b memory usage at some value
DC: y
 - Cluster: a memory usage at some value
How do i do this?
hi @grant2 @melori.arellano please help me on this post also Extract Unified Alert Classic Condition in Grafana OSS to Slack
thanks in advance
Hello! This solution doesn’t seem to work for google chat notifications. Do you know how it works for google chat?

Hello! This solution doesn’t seem to work for google chat notifications. Do you know how it works for google chat?
You’re missing an {{ end }} at the end of the template ![]()
1 Like
Hi all, ![]() please help me to restore old alerting default message and title for MS Teams from Grafana 7 by using templating of Grafana 9.
please help me to restore old alerting default message and title for MS Teams from Grafana 7 by using templating of Grafana 9.
Example of alert:

Example of panel with Legend and Value:
Configuring alert-templates in Grafana 9 requires good knowledge of Go-Templating and by default Grafana 9 provides too many unneeded output in the title and message…
Additionally some of our apps depends to the old-style, grafana sends webhooks and apps processed them based on the old alerting title and message.
All I need is
Title:
[Alerting] grafana_folder_name alertname
Message:
Legend and value
Would be very nice ![]()
1 Like
We did an update from 8.5.3 to 9.5.2 and html stopped working in Teams messages:

Templates:
{{ define "Test alert" }}
{{safeHtml "<ul>"}}
    {{safeHtml "<li>"}}
    {{ if .Labels.atm_serial_number  }}{{safeHtml "<b>"}} {{ index .Labels "atm_serial_number" }}
    {{safeHtml "</b><br>"}}{{end}}
    since {{ .StartsAt.Format "Jan 02, 2006 15:04:05 UTC" }} {{safeHtml "</li>"}}
{{safeHtml "</ul>"}}
{{ end }}
{{ define "Test message" }}
  {{ if gt (len .Alerts.Firing) 0 }}
    {{ range .Alerts.Firing }} {{ template "Test alert" .}} {{ end }}
  {{ end }}
  {{ if gt (len .Alerts.Resolved) 0 }}
    {{ range .Alerts.Resolved }} {{ template "Test alert" .}} {{ end }}
  {{ end }}
{{ end }}
What am I missing? Where is the catch? The same templates work fine in 8.5.3.
Hi! ![]() Grafana 9.1 moved from old Message cards (deprecated) to the new Adaptive Cards in Microsoft Teams. However, that does mean HTML is no longer supported.
Grafana 9.1 moved from old Message cards (deprecated) to the new Adaptive Cards in Microsoft Teams. However, that does mean HTML is no longer supported.
Thanks, George, for the quick reply! Missed that part in the release notes unfortunately.