-
What Grafana version and what operating system are you using?
The latest Grafana Enterprise version (trial) -
What are you trying to achieve?
Trying to trial out the GEM for my company.
we’d like to get a hands on experience on how this all work. -
How are you trying to achieve it?
I followed the documentation Get started with Grafana Mimir using the Helm chart | Grafana Labs Helm charts documentation to install via helm chart. the installation was successful -
What happened?
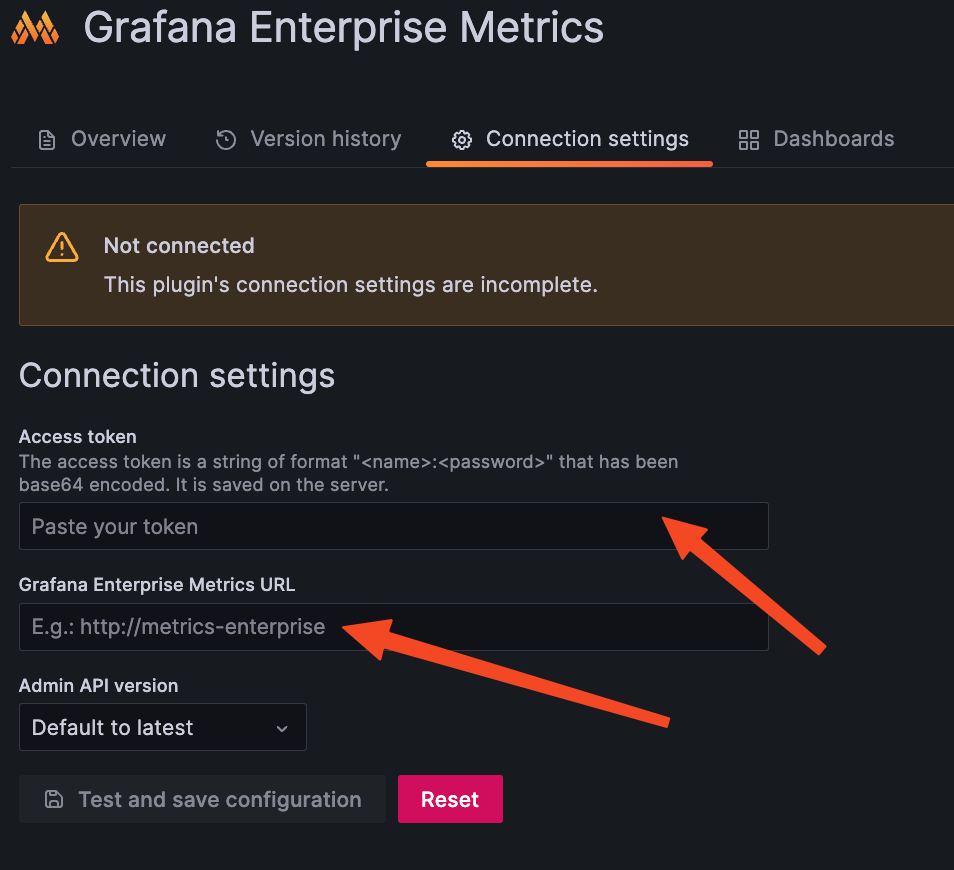
but I have trouble adding Grafana Enterprise Metrics plugin, we don’t knowhow to fill up the access token and Grafana Enterprise Metrics URL field.
-
What did you expect to happen?
-
Can you copy/paste the configuration(s) that you are having problems with?
-
Did you receive any errors in the Grafana UI or in related logs? If so, please tell us exactly what they were.
see the screenshot above -
Did you follow any online instructions? If so, what is the URL?
Set up the GEM plugin for Grafana | Grafana Enterprise Metrics documentation, in this guide, it says: * Access Token: Enter the admin-scoped access token that you generated when setting up your GEM cluster. -
Enterprise Metrics URL: Enter the URL of your GEM cluster. For single-process clusters, this is any node in the cluster. For microservice deployments, this URL is the GEM gateway.
but i didn’t generate any admin token during the setup (I followed the helm chart deployment guide). also how do I get the URL of GEM Gateway. I do have the mimir-gateway running

any pointer would be much appreciated. thanks.