Hi folks,
I’m a beginner with Grafana just spent some days in it but really like it so far.
I’m playing around with Node-Red, Influx 1.8 and Grafana 9.0.9 on my Raspberry Pi 3b
In my Influx:
- measure holding the hourly usage in kWh
- measure with the hourly price per kWh
In Grafana I’m fetching these measures into a chart.
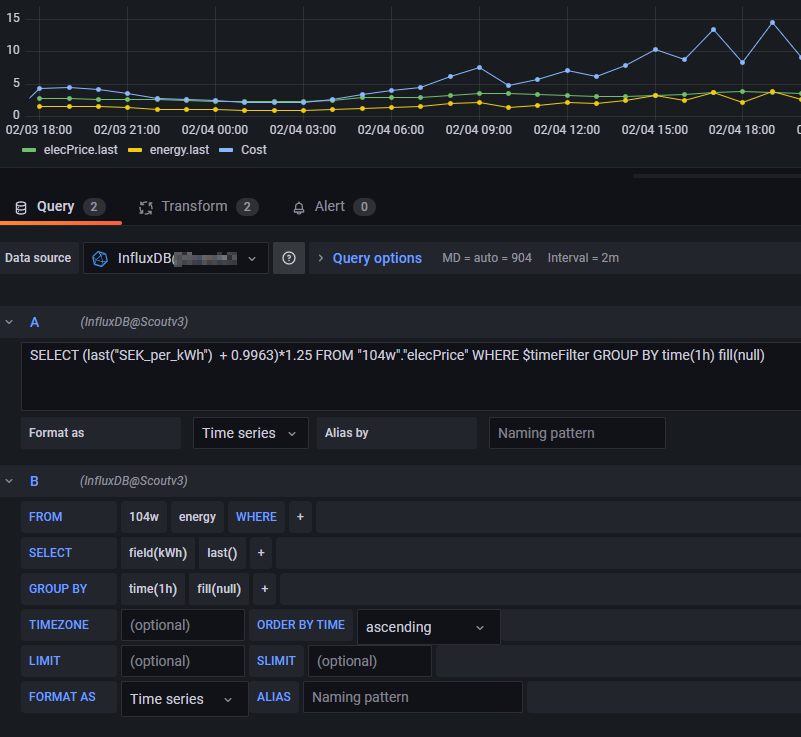
To get the total cost I have to add another tax (+0.9963) and VAT (*1.25).
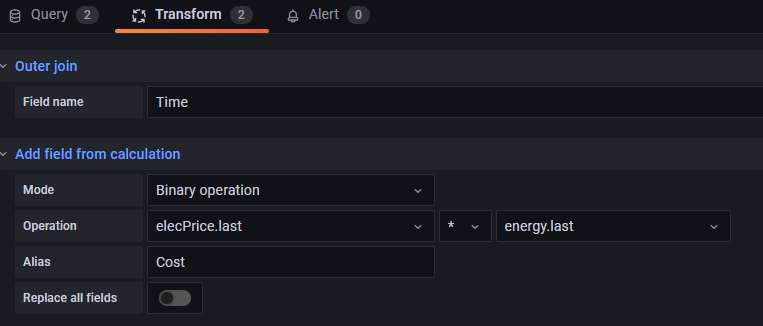
So far so good. Now I add a transformation to join the kWh and price together to get my cost per hour. This also works as a charm ![]()
Now I would love to take the following steps:
1 Sum my cost per day
2 Sum my cost per month
3 Add the tax as a variable per month
- I cannot find a way to accumulate the cost I’ve created in the transform step per day. Any hints how that can be done?
- I have understood that Grafana is missing some date-functions so accumulating per month will be even harder since I couldn’t find a way just accumulating the kWh per month in a bar-chart.
- There are fees which changes once or twice per year. I would appreciate to have these stored in a table per month and not per hour. Any hints on how to proceed there? I’m thinking the answer will be to incorporate it in the price-measure when Node-Red writes to Influx is the way forward but would like your suggestions.
