I have log report in JSON format, containing statistics like this:
{
        "import": {
          "imported": 96,
          "unchanged": 8,
          "ignored": 88
        },
}
How can I aggregate those values to build stacked chart, without describing each value in separate query?
Here is example if same data, collected via prometheus:
import{status="imported"} 96
import{status="unchanged"} 8
import{status="ignored"} 88
that can be easily visualized in stacked chart via simple query by label, like this:
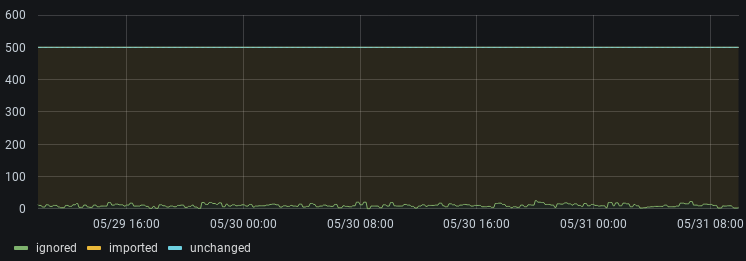
Can anybody give me example, how can I gain same chart from Loki record in JSON format?