Hi,
I’m using a recent “grafana-entreprise” docker image from docker hub, with influxDB datasources, and I have a strange display bug.
REPOSITORY                   TAG       IMAGE ID       CREATED       SIZE
influxdb                     2.7       13eafb60d977   2 weeks ago   378MB
grafana/grafana-enterprise   latest    e52ba16e8c2e   5 weeks ago   416MB
I can also reproduce this blocking bug with latest 10.3.1 image :
REPOSITORY                   TAG       IMAGE ID       CREATED       SIZE
grafana/grafana-enterprise   10.3.1    c67fc2633aa6   2 days ago    423MB
influxdb                     2.7       13eafb60d977   2 weeks ago   378MB
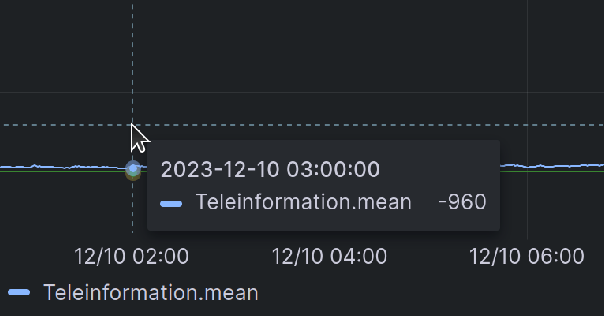
The time scale displayed in abscissa doesn’t match the displayed time when I hover my chart :
- the time used in chart is the local time (UTC+01:00 [Europe/Paris]) (03:00:00 as u can see near the cursor)
- the time used in abscissa is UTC time (02:00:00 as u can see on the abscissa time scale below the cursor)
How can I fix this and have both use local time ?
When I open the time range list box, in the upper right of my dashboard, I can see it’s supposed to use “France, CET” local time as expected :

I’ve also tried to set up general preferences in administration with no success.
P.S. : when I open the same chart in InfluxDB GUI, I can chose UTC or local time, and it instantly changes the chart, the range and the abscissa time scale.
P.P.S. : if I switch my dasbhoard settings to “UTC”, the abscissa scale doesn’t change, but the time shown when I hover the chart is now UTC I can see 02:00:00 above 00:02:00. For me this can only be a bug and a blocking one for the supervision feature we intend to implement using Grafana : the abscissa and the displayed hover time must use the same settings in all cases.

