So it looks like that the SQL query is not correct and that is why it does not the expected output you required (nothing to do with Grafana here).
The correct way will be 1st to fix your sql query to show results you require and then once that part done, can be used in the Grafana and use it in there.
You can do that directly via MySQL console (if you are familiar with) or inside Grafana and best way to do that is to goto “Explore” → select the correct “data source” and then define your query.
hmm ok thx.
That’s the problem that I can’t solve this for me complex MySQL query and I even don’t know if it is possible since not every month has the same amount of days etc.
So has nobody done that before or probably solved it differently by using as script that makes a new table with all the calculations already done separately and not via SQL querry
thx and yes my db is not on UTC it is on the timezone “Europe/Berlin”. But I set the settings “Session Timezone” to Europe/Berlin in the DB settings of Grafana so this shouldn’t be the problem or am I wrong?
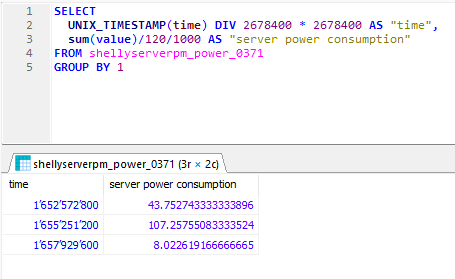
SELECT
  $__timeGroupAlias(time, 30d),
  sum(value)/120/1000 AS "server power consumption"
FROM shellyserverpm_power_0371
GROUP BY 1
with the Intervall of 30d it only shows 2 bars as expected. However when I set this to 31d I do get the same bars (3 of them) as with the 1M Intervall. So is 1M = 31d???
What about months with just 30days like June or 28 like February???
Im trying to do the same. From an energy counter i am sending data to sqldb and i want to generate bar graph in grafana for daily, monthly energy consumption.