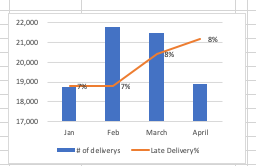
I need to display two series as total/average values per month. The data itself has one entry for each day:
Time - 2019/01/06 ValA - 50 ValB - 0.06 and so on.
Is this possible? If so what should be the steps? Thanks
I managed to to this using SQL Server Views. Couldn’t find any native way in Grafana.
Another question then:
I would like to tell Grafana to use the name of the month as the X-Axis Label. Is this supported?