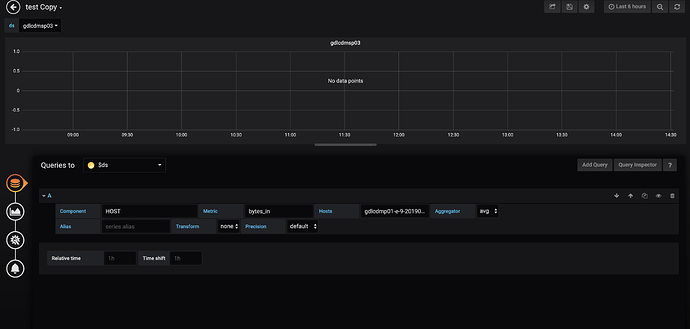
I am creating a variable of type “datasource” and the datasource is an ambari metrics collector plugin.
The variable gets created and all the relevant datasource gets populated under the dropdown in the dashboard. I also changed the datasource to the variable in the panel of the graph.
Now, when I choose a specific datasource from the dropdown I do not see any metrics getting populated.
The query inspector does not load anything. The logs in debug mode does not show anything significant.
Could somebody please help?
In the screenshot it doesn’t look like you are using the variable in the Queries to field? You should select the variable you created: $ds.
Like this:
I tried that too, still no luck 
Below is the definition of the variable
Are you sure that it is not working? In that first screenshot, you have chosen gdlcdmp01 and it has no data points so that is nothing to do with the datasource template variable.
If you open the the Chrome developer tools and the network tab, what does the hostname query parameter contain:
You are looking at the wrong http request. Can you click on the refresh query button in Grafana (top right hand corner) to trigger a metric query and then you should see a request to the url: metrics?...
It should also trigger a query if you change the value in the ds dropdown.
Another thing to try is to change your template variable to not be multi-value. That might be messing up the query.
Below is the variable definition now after removing the multi-value
When I click on refresh, the loading icon that generally rotates at the top right of the panel does not appear and an annotations? request appears as show in below screenshot (I clicked Refresh button 5 times).
When I click on the annotations?dashboard… below is what I see
Also in the networks section of developers tool under the “console” I see the below messages but then this is chrome specific. I tried refresh button on firefox, it does not show these messages there, but the panel does not get refreshed.
Also, the Query Inspector does not load any query at all. It just rotates the icon there as below:
Also, I do not see a metrics query being fired on clicking refresh, it fires an annotation query as shown in the screenshot
@ daniellee - Could you please guide me on how I can get this resolved? I even tried with the latest version of grafana and I am seeing the same issue. I tried it on firefox and chorme, still same issue.
Looks like the problem is nothing to do with the template variable- you are getting Cross Origin (CORS) errors. CORS is a security feature in modern browsers.
Sorry - I assumed that you had everything working and then tried to add templating. Guessing this has never worked?
Can you show a screenshot of the datasource config page. Do you get the same CORS error when you click Save & Test?
The datasource individually works fine. I am able to plot graphs when I just select this datasource in the panels. its an issue only when I create variables of type datasource.
daniellee - any advice on this?
This looks like a bug in the Ambari datasource plugin.
Looking at the code, I don’t really understand the logic around queries with template variables. It checks the names and values of template variables which is unusual for a datasource to do.
- It checks if the query contains template variables which will be true in this case
- an empty array is created to hold the queries
- then it checks if the template variable has the value
yarnqueues which will usually be false
- then it checks if the second template variable has the name
hosts which will usually be false
- So no queries are added to the array and nothing is executed.
You could report an issue on the GitHub project for the ambari plugin. Or fork it and modify the code around template variables if that is possible for you (and maybe send a PR).
Thanks for your help @daniellee. Really appreciate it!


