Hi,
I created the below graph to show how many payments I have for each day.
I need this to be “time agnostic” and show how many payment were done relative to the first day of the month, and I compare this vs prev months etc.

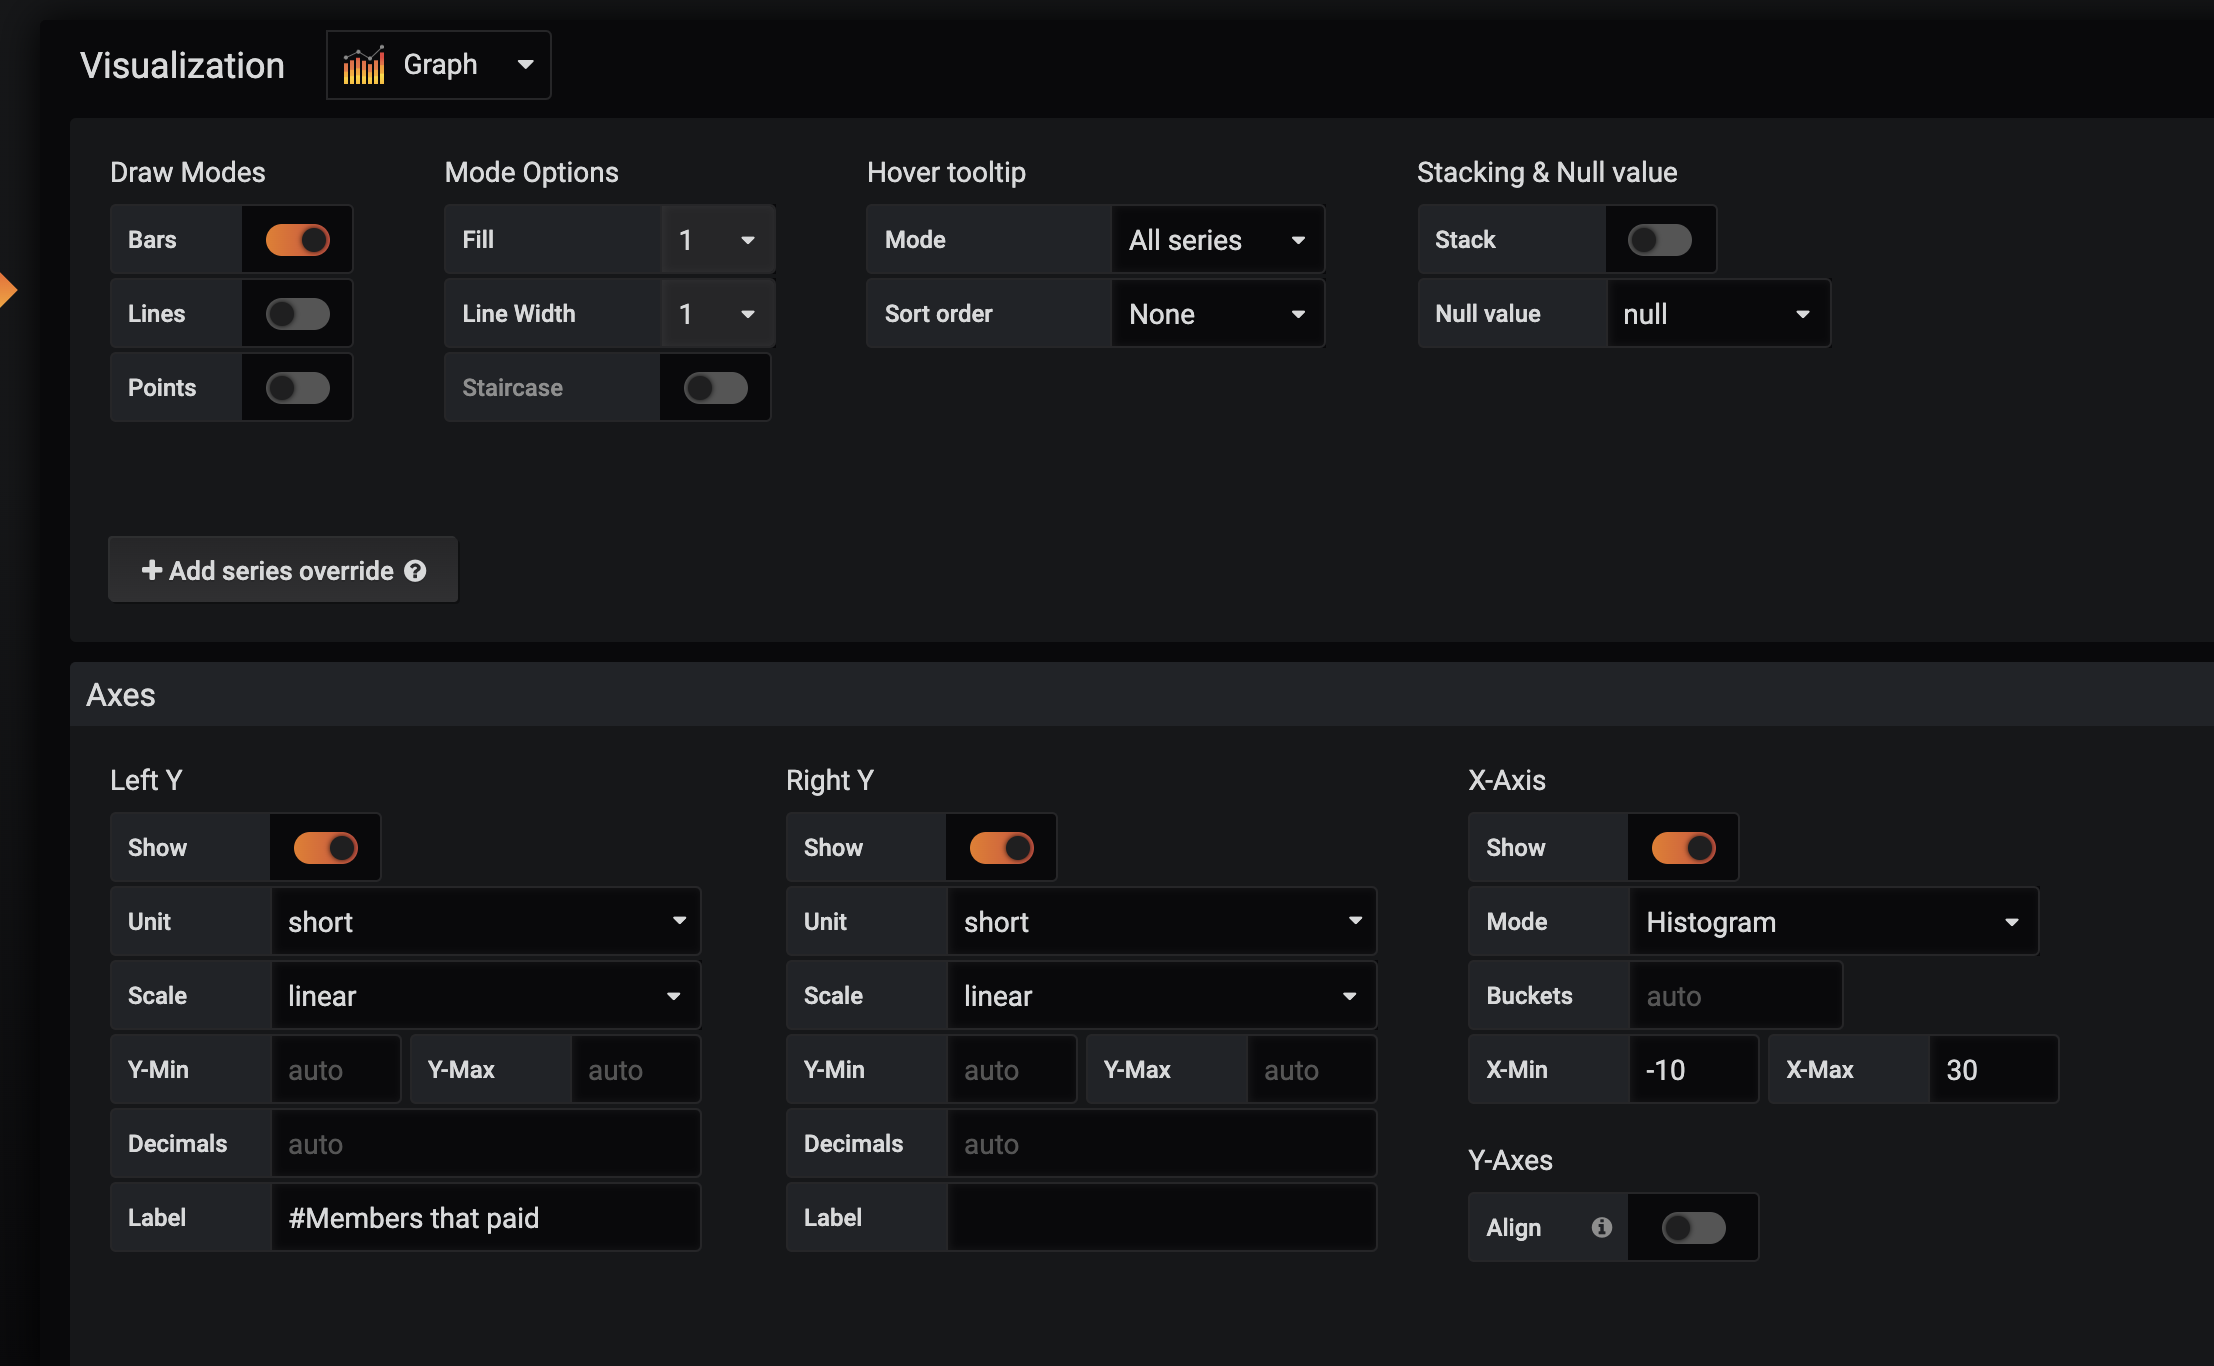
I used a graph and the following configuration to show it in a way of histogram.
The time column is the number of days since the beginning of the month, so not a real date (e.g. 1, 2, 3, 4… minus values are for payments that were done ahead of time)
My problem is that I can’t get read of the “Data points outside time range” message…
Any idea how I can fix that, or use a different way to show this graph?
Thanks,
Benny