Issue
“Broken pipe” error is thrown when executing PromQL (from Grafana) with a longer time range. This broken pipe occurs between Grafana and vmselect. This usually occurs between 3-5s. Grafana appears to terminate the network connection while vmselect attempts to write results to the channel.
To Reproduce
Invoke below from Grafana.
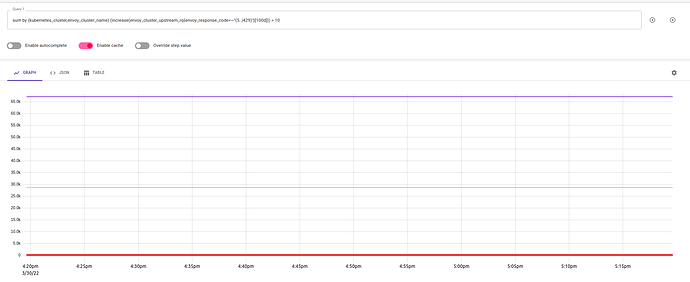
sum by (kubernetes_cluster,envoy_cluster_name) (increase(envoy_cluster_upstream_rq{envoy_response_code=~"(5..|429)"}[100d])) > 10.
Expected behavior
PromQL returns with results.
Actual behavior
PromQL times out between 3-5s (ref below screenshot).
Logs
vmselect
severity: "ERROR" textPayload: "2022-03-16T13:36:10.446Z warn VictoriaMetrics/app/vmselect/main.go:563 error in "/select/0/prometheus/api/v1/query_range?end=1647437400&query=envoy_cluster_upstream_rq%5B7776000s%5D&start=1639661400&step=3600": error when executing query="envoy_cluster_upstream_rq[7776000s]" on the time range (start=1639661400000, end=1647437400000, step=3600000): cannot send query range response to remote client: cannot send 2 bytes to client: write tcp4 10.0.0.24:8481->10.0.7.148:38124: write: broken pipe" timestamp: "2022-03-16T13:36:10.446458671Z"
Screenshots

Version
vmselect:v1.72.0
Grafana version v8.3.3 (30bb7a93ca)
Parameters
- search.maxQueryDuration = 30s [VM]
- grafana.client.timeout = 20s [Grafana Helm]
- GrafanaDataSource jsonData:timeInterval = 25s (below CRD).
apiVersion: integreatly.org/v1alpha1 kind: GrafanaDataSource metadata: name: cluster-victoriametrics spec: name: victoriametrics.yaml datasources: - name: Prometheus type: prometheus access: proxy url: http://namespace.cluster:<port>/select/0/prometheus/ isDefault: true version: 1 editable: false jsonData: tlsSkipVerify: true timeInterval: "25s"
Question
I expected GrafanaDataSource jsonData:timeInterval of 25s (above) to be relevant for the vmselect invocation. But it seems Grafana times out within 3-5s. What is the correct timeout to set on the Grafana side for VictoriaMetrics PromQL queries. ?
