Hello
I have started to use grafana-4.3.2 with influxdb-1.2.4-1 on Linux box.
I created measures and currently updating measures with lots of data every 5 minutes.
I added my datasource into grafana.
I select one of the my measures that I am pretty sure it has lots of records other than 0 and then select one of tags for where condition and set a value for it.
Then I select a field from list box for select command and also I use mean () and non_negative_derivative (5m)
For group by section I used time ($__interval) and fill (null)
For Format As section I selected TimeSeries and saved my dashboard. But there is no timeseries chart yet.
I copied SQL from grafana dashboard configuration and then run in influxdb commandline I could see the records. I also tested datasource Save&Test button, It’s working.
So why grafana could not display anything on dashboard with my existing data?
Do you have any recommendation ?
thanks
By the way : I am newbie on Grafana and Influxdb so I might have some errors and terminology problem, sorry for that
Hello Danielle
Thanks for your response
I tried with proxy mode, no positive progress
I tried points in Display menu, no positive progress.
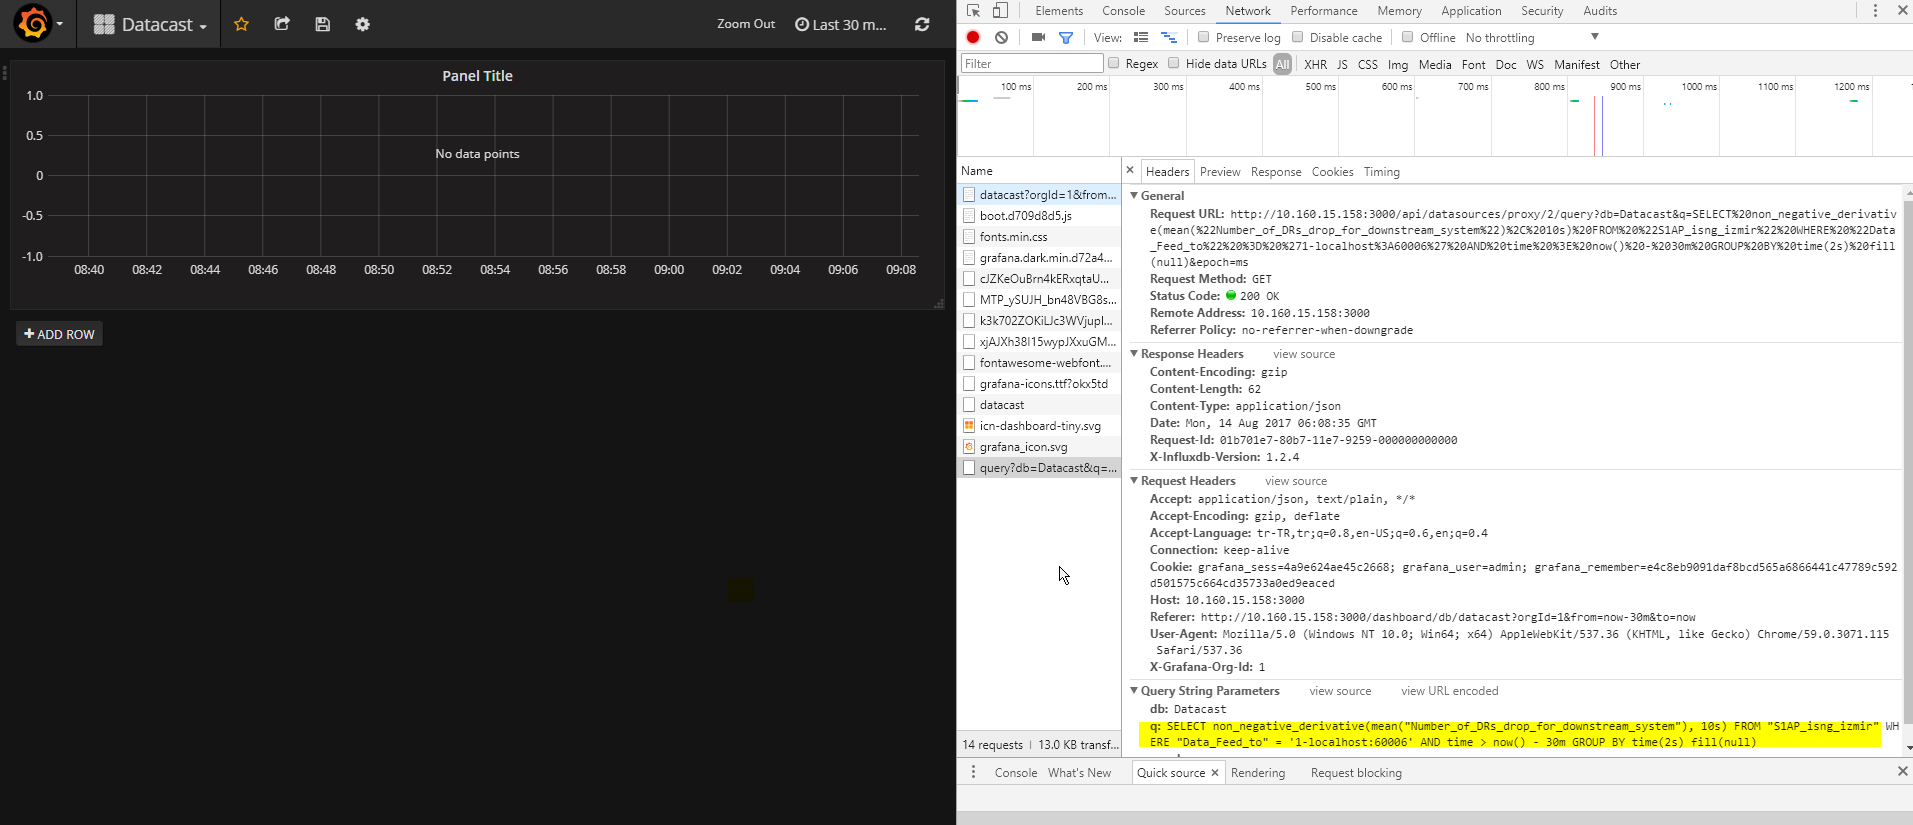
I am sharing my new inputs in following lines
But there is no response output in “Response” tab
So I checked query from console and try to get data using same query. I removed conditions from query to get data
> Connected to http://localhost:8086 version 1.2.4
> InfluxDB shell version: 1.2.4
> > use Datacast
> Using database Datacast
> > SELECT non_negative_derivative(mean("Number_of_DRs_drop_for_downstream_system"), 10s) FROM "S1AP_isng_izmir" WHERE "Data_Feed_to" = '1-localhost:60006' AND time > now() - 30m GROUP BY time(2s) fill(null);
> > SELECT non_negative_derivative(mean("Number_of_DRs_drop_for_downstream_system"), 10s) FROM "S1AP_isng_izmir" WHERE "Data_Feed_to" = '1-localhost:60006' AND time > now() - 30m
> ERR: error parsing query: non_negative_derivative aggregate requires a GROUP BY interval
> > SELECT "Number_of_DRs_drop_for_downstream_system" FROM "S1AP_isng_izmir" WHERE "Data_Feed_to" = '1-localhost:60006' AND time > now() - 30m;
> > SELECT "Number_of_DRs_drop_for_downstream_system" FROM "S1AP_isng_izmir" WHERE "Data_Feed_to" = '1-localhost:60006';
> name: S1AP_isng_izmir
> time       Number_of_DRs_drop_for_downstream_system
> ----       ----------------------------------------
> 1501176000 3.47208307e+08
> 1501176300 3.49037968e+08
> 1501176600 3.50865425e+08
> 1501176900 3.52690989e+08
> 1501177200 3.54509908e+08
> 1501177500 3.56313513e+08
> 1501177800 3.58124133e+08
> 1501178100 3.59928165e+08
> 1501178400 3.6173362e+08
> 1501178700 3.63532528e+08
> 1501179000 3.65327874e+08
> 1501179300 3.67074007e+08
> 1501179600 3.68880814e+08
> .....cont..........
>
>
> [msuluhan@naap10 bin]$ date -d @1501176000       --> this is the first date in "S1AP_isng_izmir"
> Thu Jul 27 20:20:00 +03 2017
> [msuluhan@naap10 bin]$ date -d @1502690700      --> this is the last date in "S1AP_isng_izmir"
> Mon Aug 14 09:05:00 +03 2017
So what do you think about my problem ? what am I missing ?
Thanks
Excuse the late reply - I was on vacation last week. Did you get anywhere with this? The problem is that your query is not returning any data (so it is not a problem with any settings in Grafana).
I would guess that it is the group by that is incorrect. Two seconds sounds like a very small interval to group by. Like I mentioned before trying setting the Group by time interval to something larger (ideally it should match the interval in which data is written to your InfluxDB database. For example, in the data you show above it looks like regular 5 minute intervals).