4.5.2 (2017-09-22)
Fixes
- Graphite: Fix for issues with jsonData & graphiteVersion null errors #9258
- Graphite: Fix for Grafana internal metrics to Graphite sending NaN values #9279
- HTTP API: Fix for HEAD method requests #9307
- Templating: Fix for duplicate template variable queries when refresh is set to time range change #9185
- Metrics: dont write NaN values to graphite #9279
4.5.1 (2017-09-15)
Fixes
- MySQL: Fixed issue with query editor not showing #9247
Breaking changes
- Metrics: The metric structure for internal metrics about Grafana published to graphite has changed. This might break dashboards for internal metrics.
4.5.0
New release now available for download.
Highlights
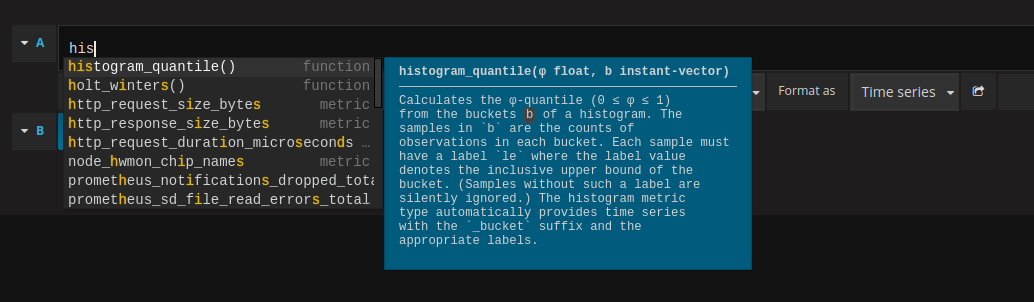
New prometheus query editor
The new query editor has full syntax highlighting. As well as auto complete for metrics, functions, and range vectors.

There is also integrated function docs right from the query editor!
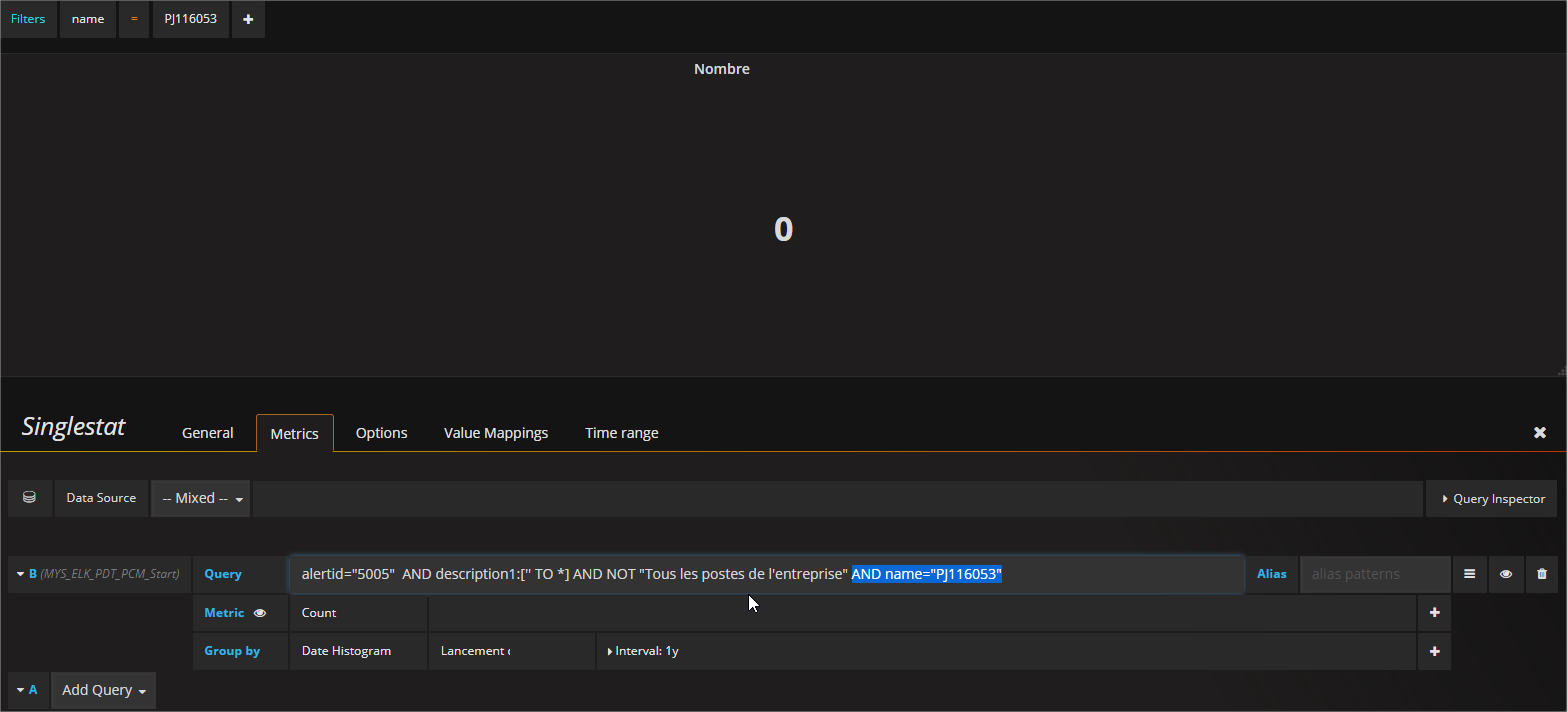
Elasticsearch: Add ad-hoc filters from the table panel
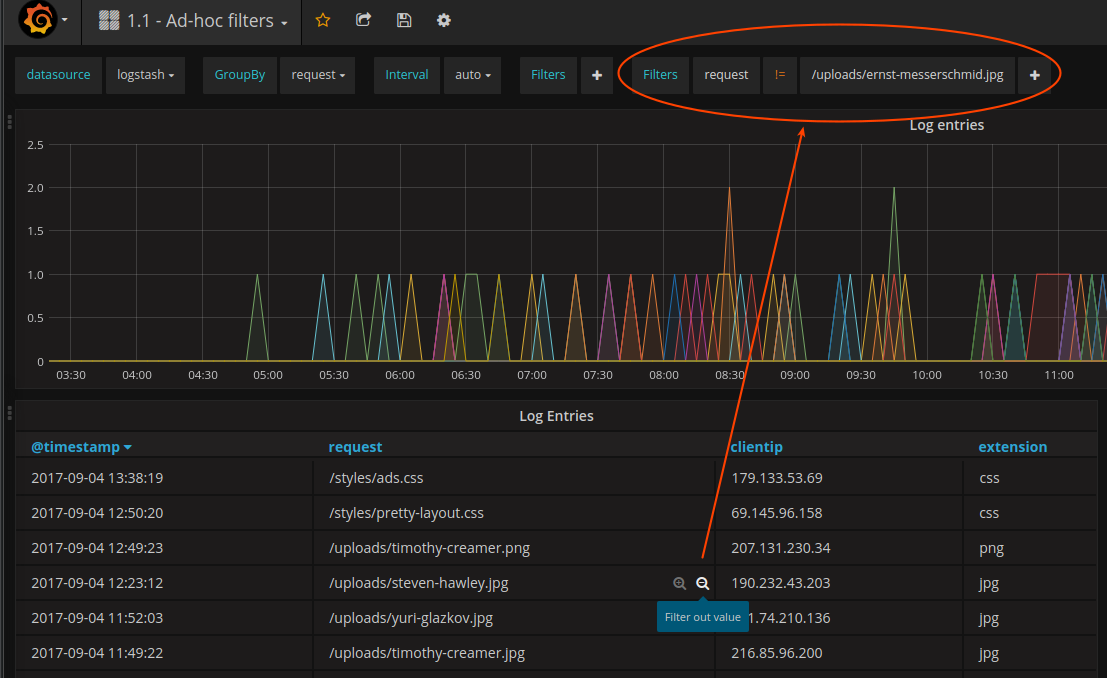
Table cell links!
Create column styles that turn cells into links that use the value in the cell (or other other row values) to generate a url to another dashboard or system:

Changelog
New Features
- Table panel: Render cell values as links that can have an url template that uses variables from current table row. #3754
- Elasticsearch: Add ad hoc filters directly by clicking values in table panel #8052.
- MySQL: New rich query editor with syntax highlighting
- Prometheus: New rich query editor with syntax highlighting, metric & range auto complete and integrated function docs. #5117
Enhancements
- GitHub OAuth: Support for GitHub organizations with 100+ teams. #8846, thx @skwashd
- Graphite: Calls to Graphite api /metrics/find now include panel or dashboad time range (from & until) in most cases, #8055
- Graphite: Added new graphite 1.0 functions, available if you set version to 1.0.x in data source settings. New Functions: mapSeries, reduceSeries, isNonNull, groupByNodes, offsetToZero, grep, weightedAverage, removeEmptySeries, aggregateLine, averageOutsidePercentile, delay, exponentialMovingAverage, fallbackSeries, integralByInterval, interpolate, invert, linearRegression, movingMin, movingMax, movingSum, multiplySeriesWithWildcards, pow, powSeries, removeBetweenPercentile, squareRoot, timeSlice, closes #8261
- Elasticsearch: Ad-hoc filters now use query phrase match filters instead of term filters, works on non keyword/raw fields #9095.
Breaking change
- Elasticsearch: Elasticsearch metric queries without date histogram now return table formated data making table panel much easier to use for this use case. Should not break/change existing dashboards with stock panels but external panel plugins can be affected.
- InfluxDB/Elasticsearch: The panel & data source option named “Group by time interval” is now named “Min time interval” and does now always define a lower limit for the auto group by time. Without having to use
>prefix (that prefix still works). This should in theory have close to zero actual impact on existing dashboards. It does mean that if you used this setting to define a hard group by time interval of, say “1d”, if you zoomed to a time range wide enough the time range could increase above the “1d” range as the setting is now always considered a lower limit.
This option is now rennamed (and moved to Options sub section above your queries):

Datas source selection & options & help are now above your metric queries.

Minor Changes
- InfluxDB: Change time range filter for absolute time ranges to be inclusive instead of exclusive #8319, thx @Oxydros
- InfluxDB: Added paranthesis around tag filters in queries #9131
Bug Fixes
- Modals: Maintain scroll position after opening/leaving modal #8800
- Templating: You cannot select data source variables as data source for other template variables #7510
4.5.0 (2017-09-14)
Fixes & Enhancements since beta1
- Security: Security fix for api vulnerability (in multiple org setups).
- Shortcuts: Adds shortcut for creating new dashboard #8876 thx @mtanda
- Graph: Right Y-Axis label position fixed #9172
- General: Improve rounding of time intervals #9197, thx @alin-amana