Please see below for the informations:
-
What Grafana version and what operating system are you using?
-I am running latest version of Grafana -
What are you trying to achieve?
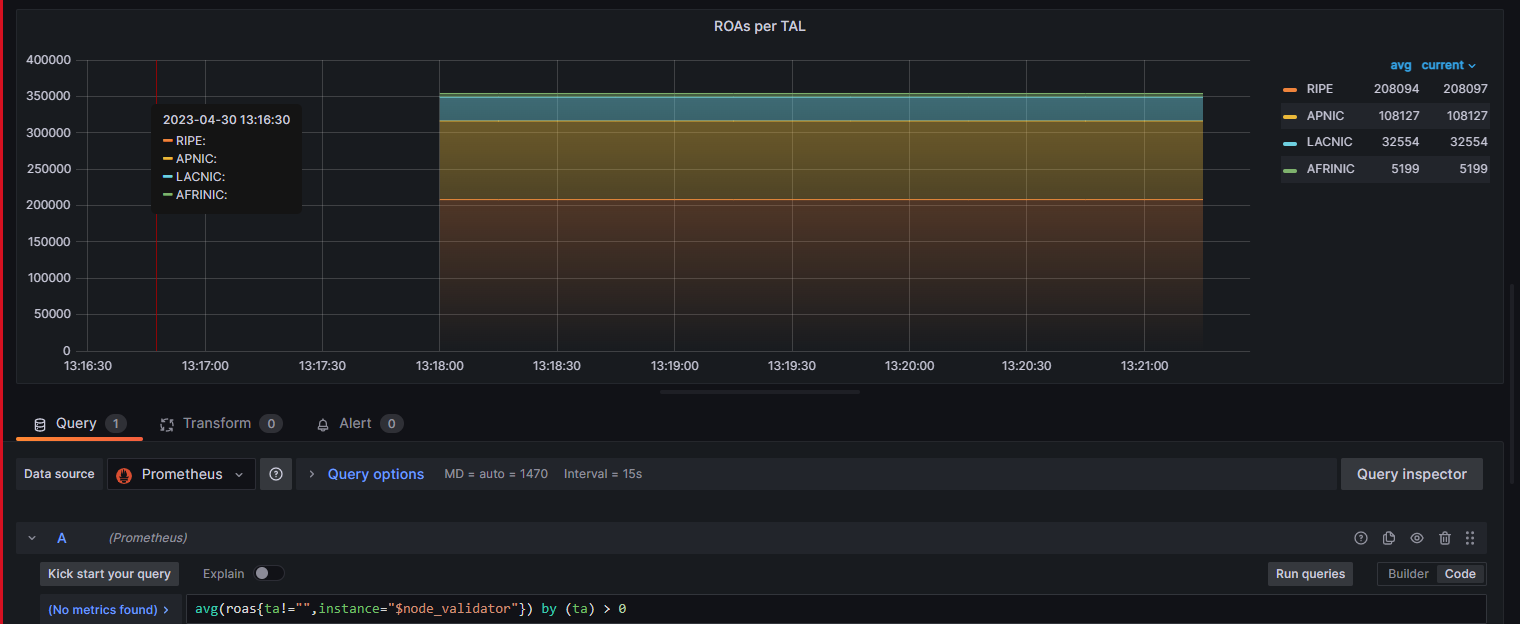
-I’m trying to include all TALs on the OctoRPKI dashboard -
How are you trying to achieve it?
-By pulling metrics from OctoRPKI by using prometheus and send a query from Grafana to Prometheus. -
What happened?
-ARIN ROAS not showing on OctoRPKI Dashboard -
What did you expect to happen?
-ARIN ROAS to show on OctoRPKI Dashboard -
Can you copy/paste the configuration(s) that you are having problems with?
-
Did you receive any errors in the Grafana UI or in related logs? If so, please tell us exactly what they were.
-No -
Did you follow any online instructions? If so, what is the URL?
-No