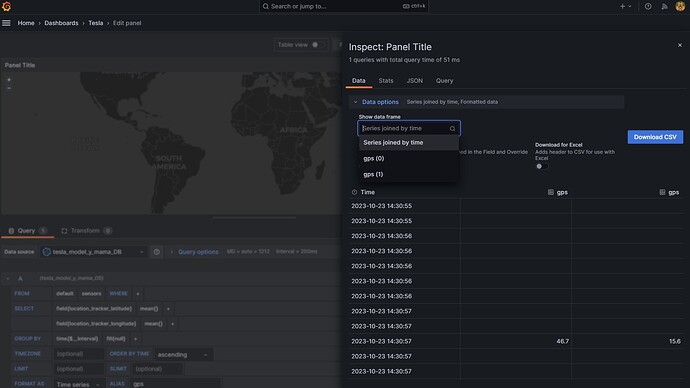
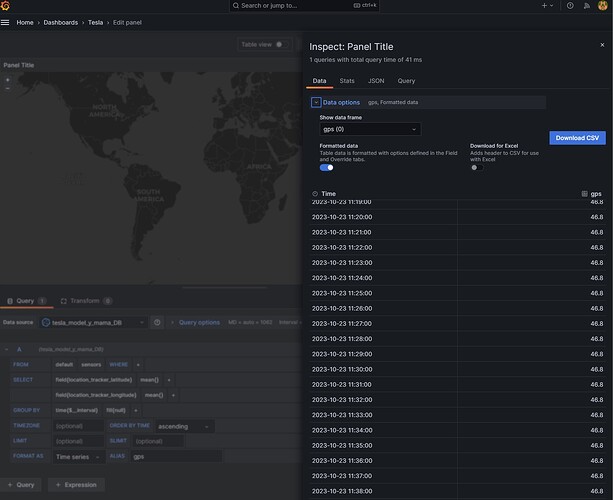
I tried to use another transformation and now it shows the table with one time series column and latitude and longitude in the other 2 columns. But it’s still not working.
Hi @yosiasz I used the query inspector and selected the “Data frame option” - “Series joined by time” to get both fields into one table… otherwise I have 2 tables.
the CSV export looks like this:
You need a timestamp, you need a latitude and longitude, and you need a metric…
Hi @sowdenraymond, thanks for your hint. Can you suggest a page or YouTube videos where I can learn how to build up my queries in the correct way? I use node-red to push the data into an influxDB.
Each of your posts get more confusing than the previous one.
You are being asked questions that you are not answering, suggestions you are not implementing.
Please provide schema of your table. Column names and data type of each
Yes, I feel the same. I am very sorry about that. ![]()
It’s because I don’t understand what exactly you mean.
What table? What column names and what data types?
I have data in influxDB, it should be always a timestamp and a value.
In the influxDB I have a field for latitude with a value and a field for longitude with a value.
In grafana I select the influxDB as data source and add a query with the 2 fields latitude and longitude.
And the result is what I’ve shown you.
I should probably first learn better how to use this stuff…
I just copied stuff from others and it always worked until now.
Only you can tell us that info.
I agree with your prognosis of brushing up on influxdb
There is a switch at the top of the panel builder:
this lets you view your “raw” data as a table.
This is helpful for troubleshooting, especially when asking for help, as we cannot see your data or use case.
It also helps to show the queries that you used to get the data. Then you can explore your data and export it to csv
This lets other people use your data and import it in their systems to see what you are seeing
in your 2nd screenshot above, you are getting time, latitude and longitude, you also need a metric value…
hmm okay thanks will try that
I didn’t know I need that since I only use the time, lat and long for a route map.
sample line protocol you should provide us
sensors,device=speed latitude=52.4943235 1687867200000000000
sensors,device=speed latitude=52.4943705 1687867380000000000
sensors,device=speed longitude=0.7166274 1687867680000000000
sensors,device=speed longitude=0.7165727 1687867800000000000
sensors,device=speed longitude=0.7168433 1687867860000000000
sensors,device=speed longitude=0.7169106 1687867920000000000
sensors,device=speed speed=0.651 1687868220000000000
sensors,device=speed speed=0.891 1687868280000000000
sensors,device=speed speed=0.912 1687868340000000000
sensors,device=speed speed=0.327 1687868400000000000
thanks I got it to work. I had to change the influxDB datasource in Grafana from InfluxQL to Flux. So I was able to create the Query via code, like I saw it in your answers to other people. I still don’t know why it didn’t work with the InfluxQL and the Editor Mode.
Could you share your solution?
Thx
hey can you share with me how you got the solution? Does your geomap worked as needed?
Hey, just came over this thread. Can you share your solution?
I have a similar problem.
My request is as follows, can you help.
from(bucket: "iot")
  |> range(start: v.timeRangeStart, stop: v.timeRangeStop)
  |> filter(fn: (r) => r["_measurement"] == "fiat.0.XXX.location.latitude" or r["_measurement"] == "fiat.0.XXX.location.longitude")
  |> filter(fn: (r) => r["_field"] == "value")
  |> pivot(rowKey:["_time"], columnKey: ["_field"], valueColumn: "_value")
  |> drop(columns: ["_start", "_stop"])
"_time,""value fiat.0.XXX.location.latitude"",""value fiat.0.XXX.location.longitude"""
2024-08-28 12:10:08,53.6,9.88
2024-08-28 12:11:08,53.6,9.88
2024-08-28 12:12:08,53.6,9.88
2024-08-28 12:13:08,53.6,9.88
2024-08-28 12:14:09,,9.88
2024-08-28 12:14:09,53.6,
2024-08-28 12:15:08,53.6,9.88
2024-08-28 12:16:08,53.6,9.88
2024-08-28 12:17:08,,9.88
2024-08-28 12:17:08,53.6,
2024-08-28 12:18:08,53.6,9.88
2024-08-28 12:19:08,,9.88
2024-08-28 12:19:08,53.6,
2024-08-28 12:20:08,53.6,9.88
2024-08-28 12:21:08,53.6,9.88
2024-08-28 12:22:08,53.6,9.88
2024-08-28 12:23:08,53.6,9.88
2024-08-28 12:24:08,53.6,9.88
2024-08-28 12:25:08,53.6,9.88
2024-08-28 12:26:08,53.6,9.88
2024-08-28 12:27:08,53.6,9.88
2024-08-28 12:28:08,53.6,9.88
2024-08-28 12:29:08,53.6,9.88
2024-08-28 12:30:08,53.6,9.88
2024-08-28 12:31:08,53.6,9.88
2024-08-28 12:32:08,53.6,9.88
2024-08-28 12:33:08,53.6,9.88
2024-08-28 12:34:08,53.6,9.88
2024-08-28 12:35:08,53.6,9.88
2024-08-28 12:36:08,53.6,9.88
2024-08-28 12:37:08,53.6,9.88
2024-08-28 12:38:08,53.6,9.88
2024-08-28 12:39:08,53.6,9.88
2024-08-28 12:40:08,53.6,9.88
2024-08-28 12:41:08,53.6,9.88
2024-08-28 12:42:08,53.6,9.88
2024-08-28 12:43:08,53.6,9.88
2024-08-28 12:44:08,53.6,9.88
2024-08-28 12:45:08,53.6,9.88
2024-08-28 12:46:08,,9.88
2024-08-28 12:46:08,53.6,
2024-08-28 12:47:08,53.6,9.88


