What Grafana version and what operating system are you using?
Grafana cloud - latest version - latest Google Chrome on latest macOS
What are you trying to achieve?
I have a table of U.S. states, each with a color field, and a table of U.S. counties, each with geoJSON data. I’m trying to color code each county object on an orchestra cities map panel according to the color associated with each state in table one.
(The orchestra cities map panel extends the basic geomap panel in some useful ways, which is why I’m using it for this: Orchestra Cities Map plugin for Grafana | Grafana Labs)
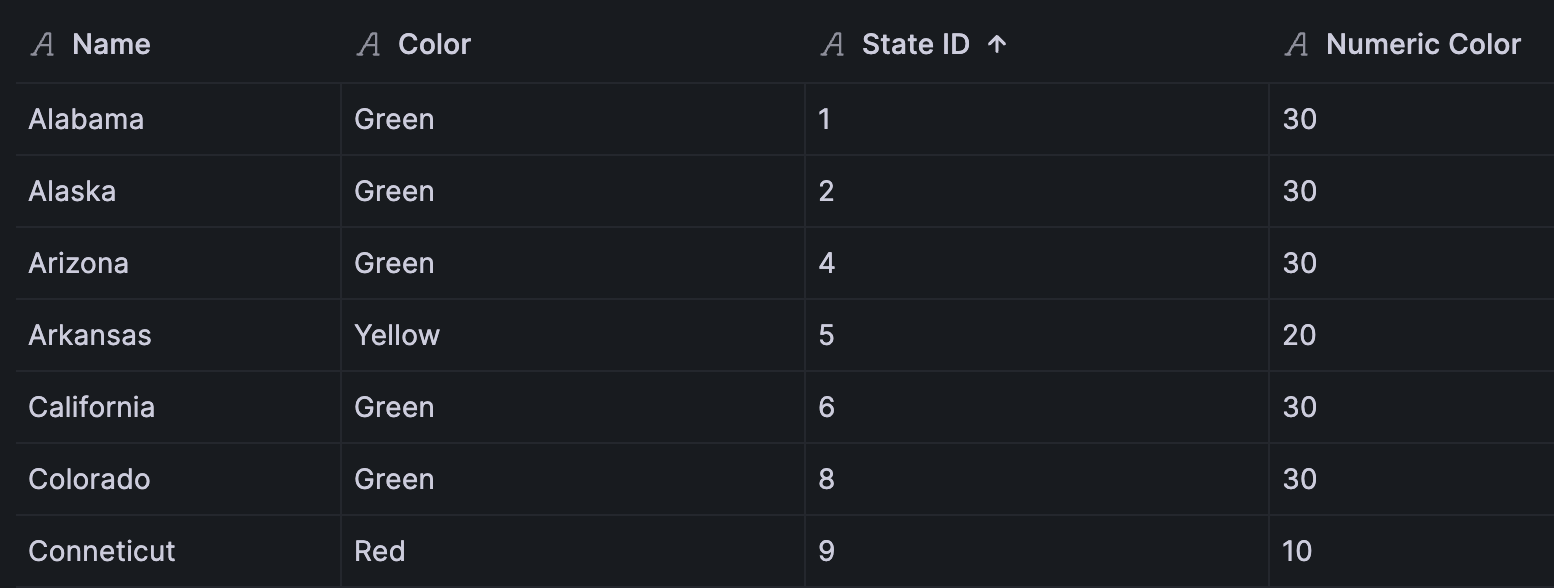
Table 1 fields and example data:
- State ID: 01
- County Name: Limestone
- Shape: (geojson shape data)
Table 2 fields and example data:
- State ID: 01
- State Name: Alabama
- Color: Green
- Numeric Color: 30
Table 1 has a record for every county in the U.S. and Table 2 has a record for every state in the U.S.
How are you trying to achieve it? and What happened?
Data for the two tables are coming from two different instances of the JSON API data source plugin, as two queries in the orchestra cities map panel.
I’ve tried to apply a Join by Field transformation using the State ID as the common key between them, but the first point of weirdness is that when picking a field it lets you choose from any of them, including the state ID from table one and the one from table two. I was under the impression that the whole point was for it to join them on the one key, but I get different behavior depending on whether I choose the state ID from the first table or the second one.
- If I join on the state ID from table one, the resulting table only has fields from table 1
- If I join on the state ID from table two, the resulting table only has fields from table 2
- switching between inner and outer joins has no effect
I must be missing something, because it seems like the joins aren’t doing anything, even though there are definitely matching values for state ID in both tables and the data types for those fields are set to the same thing (number).
For those wondering why I have a color field and a numeric color field, the color one is a string (red, yellow, or green) setup in the original data source to color code the states, while I more recently added the numeric color one (10 for red, 20 for yellow, 30 for green) in order to provide numeric data to the panel thresholds to actually do the color coding, using the "Color scheme from thresholds (by value) setting and the “marker color” option set to my numeric color field. That at least seems like it will work if I can get the transformed table to associate state colors from the second table with counties from the first table.
I also tried the merge transformation, which did actually perform what looks like a join operation, but not quite right:
- It has the state name, state Id, shape, color, and numeric color fields, but it dropped the county name for some reason
- the color and numeric color fields are also empty for every record except the first county in each state
What did you expect to happen?
I expected for my transformation to result in a table with the following fields:
- State ID: 01
- County Name: Limestone
- State Name: Alabama
- Color: Green
- Numeric Color: 30
and to have as many records as I have counties, with each county now associated with a state and color.
Did you follow any online instructions? If so, what is the URL?
Yes, the “join by field” instructions on Grafana docs:
https://grafana.com/docs/grafana/latest/panels-visualizations/query-transform-data/transform-data/
Thanks for reading this lengthy post!