Hello Grafana Community,
I am currently working on replicating a Mixpanel dashboard in Grafana, and I’m facing difficulties in recreating a specific bar graph that is broken down based on duration. I would appreciate your assistance in understanding how to achieve this in Grafana with OpenSearch DB.
The desired graph should represent a breakdown of events based on different duration ranges. Each bar in the graph should represent a specific duration . The height of each bar should reflect the count of events falling within that particular duration. As you can see the mixpanel image below

I have already set up Grafana to connect to my OpenSearch DB and successfully retrieved data for other visualizations. However, I’m unsure about the steps required to create the duration breakdown bar graph specifically.
Here’s what I have done so far:

As you can see in the above Image. I am getting the bar graph but it is not correct. It is breaking down into types but I want the “unlock” type to break down on duration.
I am using below query
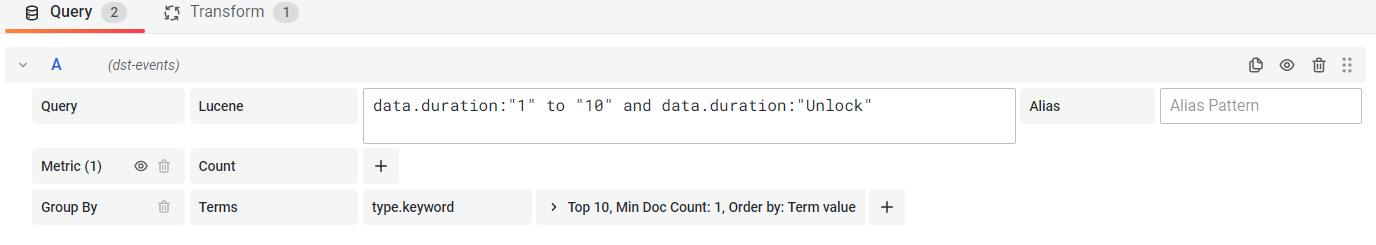
Despite these efforts, I haven’t been able to achieve the desired graph with the duration breakdown. I’m seeking guidance from the community on how to approach this and configure Grafana to display the duration breakdown bar graph based on data from OpenSearch DB.
If there are any specific plugins, panels, or queries that I need to utilize, please let me know. Additionally, if there are any considerations specific to working with OpenSearch DB in Grafana, I would appreciate your insights.
Thank you for your time and support. I look forward to your suggestions and recommendations.
Best regards,
MIR AKBER