Using docker grafana 8.4.1 and I want to see SQL DB metrics from azure in grafana.
In azure I have created LogAnalytics workspace on top of that I have added Azure Sql Analytics (preview), connected all databases to it, added service principals where necessary, and in azure I see the database metrics as I am supposed to.
Now in grafana, I have connected Azure Monitor datasource and imported its dashboards.
For example Azure Resource Overview works like a charm and Azure Storage Insights one aswell, indicating the connection to Azure works.
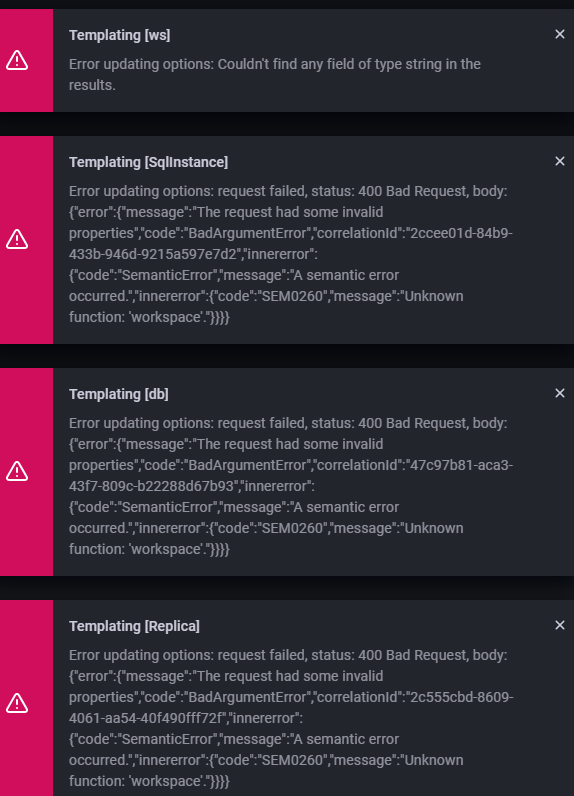
What doesn’t work is Azure Sql Database dashboard.

PS: I have followed MS documentation in configuring the loganalytics space and have contacted azure support, who confirmed everything to be well configured on azure side and they suggested turning to grafana support/community for help.